Probability Case Study Questions Class 10: CBSE PYQs with Answers
Practise 19 Class 10 Probability case-study questions from CBSE previous-year board papers (2023–2026) and official samples. The cases cover random selections, pie charts, complements, overlapping events and changing sample spaces. Count the possible and favourable outcomes, then try each part before opening its solution. Both OR alternatives are solved for practice.
19 distinct cases · 40 board-paper appearances + 3 official-sample appearances Solutions prepared by Team TutorVertex Verified by Siddharth Sir Last reviewed
n(E) counts favourable outcomes; n(S) counts all equally likely outcomes. Use the population and conditions stated in each part.
Find a case
Showing all 19 cases
No cases match these filters. Try another combination or reset the filters.
Surveys, percentages and pie charts
Basic4 marks · 1 + 1 + 2
Case 1. Blood groups in a sample of 50 people
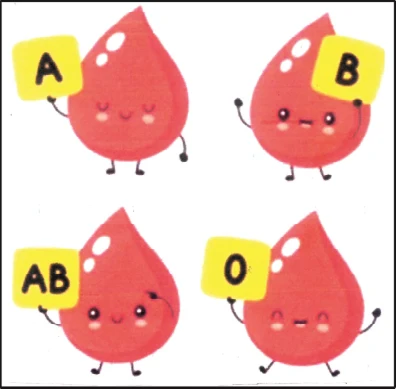
Blood group describes the type of blood a person has. It is a classification of blood based on the presence or absence of inherited antigenic substances on the surface of red blood cells. Blood types predict whether a serious reaction will occur in a blood transfusion.
In a sample of 50 people, 21 had type O blood, 22 had type A, 5 had type B and rest had type AB blood group.
Illustration retained from the official paper.
Describe the figure
The original blood-group illustration shows A, B, AB and O. Use the stated sample of 50 people; the categories are not equally frequent.
Appeared in: 2023 · Basic · Main
(i) What is the probability that a person chosen at random had type O blood? [1 mark]
Show answer and solution
Probability = .
There are 21 people with type O blood.
Total number of equally likely outcomes = 50.
Number of favourable outcomes = 21.
P(E) = .
P(E) = = .
(ii) What is the probability that a person chosen at random had type AB blood group? [1 mark]
Show answer and solution
Probability = .
Number with AB = 50 − (21 + 22 + 5) = 2.
Total number of equally likely outcomes = 50.
Number of favourable outcomes = 2.
P(E) = .
P(E) = = .
(iii)(a) What is the probability that a person chosen at random had neither type A nor type B blood group? [2 marks]
Show answer and solution
Probability = .
Neither A nor B means O or AB: favourable count = 21 + 2 = 23.
Total number of equally likely outcomes = 50.
Number of favourable outcomes = 23.
P(E) = .
P(E) = = .
OR
(iii)(b) What is the probability that a person chosen at random had either type A or type B or type O blood group? [2 marks]
Show answer and solution
Probability = .
The categories A, B and O do not overlap: favourable count = 22 + 5 + 21 = 48.
Total number of equally likely outcomes = 50.
Number of favourable outcomes = 48.
P(E) = .
P(E) = = .
Basic4 marks · 1 + 1 + 2
Case 2. Favourite colours shown in a pie chart
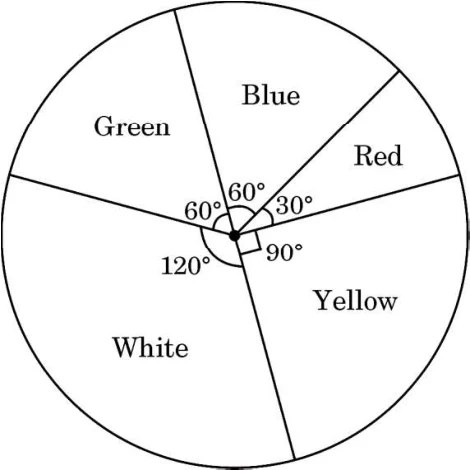
Some students were asked to list their favourite colour. The measure of each colour is shown by the central angle of a pie chart given below:
Study the pie chart and answer the following questions:
Diagram retained from the official paper.
Describe the figure
Pie-chart angles: white 120°, green 60°, blue 60°, red 30° and yellow 90°. The five angles total 360°.
Appeared in: 2023 · Basic · Main
(i) If a student is chosen at random, then find the probability of his/her favourite colour being white. [1 mark]
Show answer and solution
Probability = .
The white sector has angle 120° out of 360°.
P(white) = = .
(ii) What is the probability of his/her favourite colour being blue or green? [1 mark]
Show answer and solution
Probability = .
Blue and green sectors each have angle 60°.
Combined angle = 60° + 60° = 120°.
P(blue or green) = = .
(iii)(a) If 15 students liked the colour yellow, how many students participated in the survey? [2 marks]
Show answer and solution
Number of students = 60.
The yellow sector represents = of the students.
Let the total number of students be n.
= 15.
n = 15 × 4 = 60.
OR
(iii)(b) What is the probability of the favourite colour being red or blue? [2 marks]
Show answer and solution
Probability = .
Combined red and blue angle = 30° + 60° = 90°.
P(red or blue) = = .
Standard4 marks · 1 + 2 + 1
Case 3. Computer-based learning in 1000 schools
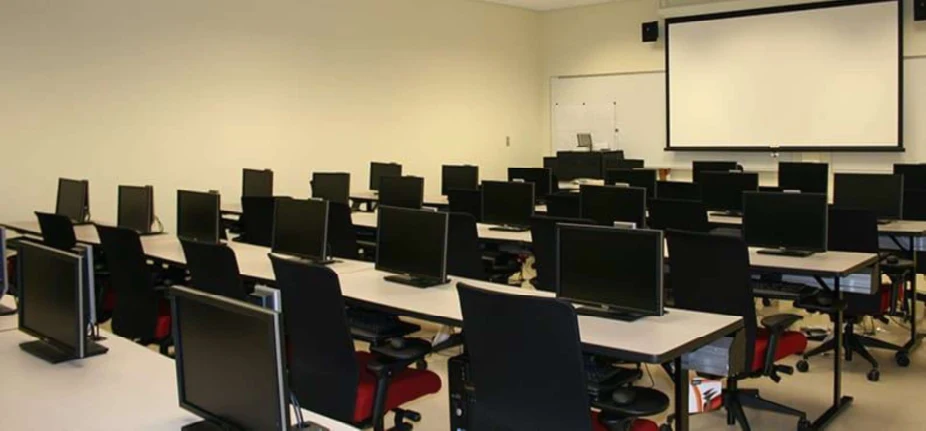
Computer-based learning (CBL) refers to any teaching methodology that makes use of computers for information transmission. At an elementary school level, computer applications can be used to display multimedia lesson plans. A survey was done on 1000 elementary and secondary schools of Assam and they were classified by the number of computers they had.
Photograph retained from the official paper.
Data given in the question
Number of computers
Number of schools
1–10
250
11–20
200
21–50
290
51–100
180
101 and more
80
One school is chosen at random. Then:
Describe the figure
The original classroom photograph is retained. The five groups contain 250, 200, 290, 180 and 80 schools, totalling 1000. Count schools, not computers or class marks.
Appeared in: 2023 · Standard · Main
(i) Find the probability that the school chosen at random has more than 100 computers. [1 mark]
Show answer and solution
Probability = .
More than 100 means the 101-and-more group, containing 80 schools.
Total number of equally likely outcomes = 1000.
Number of favourable outcomes = 80.
P(E) = .
P(E) = = .
(ii)(a) Find the probability that the school chosen at random has 50 or fewer computers. [2 marks]
Show answer and solution
Probability = .
The groups 1–10, 11–20 and 21–50 qualify: 250 + 200 + 290 = 740.
Total number of equally likely outcomes = 1000.
Number of favourable outcomes = 740.
P(E) = .
P(E) = = .
OR
(ii)(b) Find the probability that the school chosen at random has no more than 20 computers. [2 marks]
Show answer and solution
Probability = .
No more than 20 includes the first two groups: 250 + 200 = 450.
Total number of equally likely outcomes = 1000.
Number of favourable outcomes = 450.
P(E) = .
P(E) = = .
(iii) Find the probability that the school chosen at random has 10 or less than 10 computers. [1 mark]
Show answer and solution
Probability = .
The 1–10 group contains 250 schools.
Total number of equally likely outcomes = 1000.
Number of favourable outcomes = 250.
P(E) = .
P(E) = = .
Standard4 marks · 1 + 1 + 2
Case 4. Holiday transport shown in a pie chart
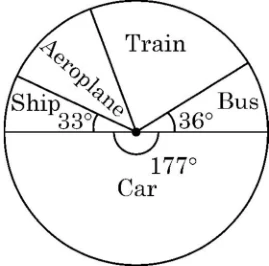
In a survey on holidays, 120 people were asked to state which type of transport they used on their last holiday. The following pie chart shows the results of the survey.
Diagram retained from the official paper.
Observe the pie chart and answer the following questions:
Describe the figure
The pie chart shows bus 36°, ship 33° and car 177°, alongside train and aeroplane sectors. The total angle is 360°. Part (iii) supplies additional probability conditions; do not invent unlabelled angles from the drawing.
Appeared in: 2024 · Standard · Main
(i) If one person is selected at random, find the probability that he/she travelled by bus or ship. [1 mark]
Show answer and solution
Probability = .
Combined angle for bus and ship = 36° + 33° = 69°.
P(bus or ship) = = .
(ii) Which is most favourite mode of transport and how many people used it? [1 mark]
Show answer and solution
Car; 59 people.
The car sector is the largest and has angle 177°.
Number travelling by car = × 120 = 59.
(iii)(a) A person is selected at random. If the probability that he did not use train is 4/5, find the number of people who used train. [2 marks]
Show answer and solution
Number using train = 24.
P(train) = 1 − = .
Number using train = × 120 = 24.
OR
(iii)(b) The probability that randomly selected person used aeroplane is 7/60. Find the revenue collected by air company at the rate of ₹5,000 per person. [2 marks]
Show answer and solution
Revenue = ₹70,000.
Number using aeroplane = × 120 = 14.
Revenue = 14 × ₹5,000 = ₹70,000.
Basic4 marks · 1 + 1 + 2
Case 5. Family structure: probabilities from percentages
Family structure: In a recent survey of this year, 51% of the families in the United States of America had no children, 20% had one child, 19% had two children, 7% had three children and 3% had four or more children.
Illustration retained from the official paper.
A family is selected at random.
Describe the figure
The original family illustration is retained. The percentages sum to 100%. This is the survey supplied in the 2024 question, not a statement about current population figures.
Appeared in: 2024 · Basic · Main
(i) Find the probability that the selected family has two or three children. [1 mark]
Show answer and solution
Probability = .
Combined percentage = 19% + 7% = 26%.
P(two or three children) = = .
(ii) Find the probability that the selected family has more than one child. [1 mark]
Show answer and solution
Probability = .
More than one means two, three, or four or more children.
Combined percentage = 19% + 7% + 3% = 29%.
Required probability = .
(iii)(a) Find the probability that the selected family has less than three children. [2 marks]
Show answer and solution
Probability = .
Less than three includes zero, one and two children.
Combined percentage = 51% + 20% + 19% = 90%.
Required probability = = .
OR
(iii)(b) Find the probability that the selected family has more than two children. [2 marks]
Show answer and solution
Probability = .
More than two includes three and four or more children.
Combined percentage = 7% + 3% = 10%.
Required probability = = .
Basic4 marks · 1 + 1 + 2
Case 6. Students’ preferred transport to school
A group of students conducted a survey to find out about the preferred mode of transportation to school among their classmates. They surveyed 200 students from their school. The results of the survey are as follows:
120 students preferred to walk to school. 25% of the students preferred to use bicycles. 10% of the students preferred to take the bus. Remaining students preferred to be dropped off by car.
Based on the above information, answer the following questions:
The official sample case is text-only. The survey has 200 students: walking 120, bicycle 50, bus 20 and car 10. Part (iii)(A) changes the transport choice of 60 walking students for that day.
Appeared in: 2024–25 · Basic · Official Sample
(i) What is the probability that a randomly selected student does not prefer to walk to school? [1 mark]
Show answer and solution
Probability = .
Not walking = 200 − 120 = 80 students.
Total number of equally likely outcomes = 200.
Number of favourable outcomes = 80.
P(E) = .
P(E) = = .
(ii) Find the probability of a randomly selected student who prefers to walk or use a bicycle. [1 mark]
Show answer and solution
Probability = .
Bicycle users = 25% of 200 = 50. Walking or bicycle = 120 + 50 = 170.
Total number of equally likely outcomes = 200.
Number of favourable outcomes = 170.
P(E) = .
P(E) = = .
(iii)(A) One day 50% of walking students decided to come by bicycle. What is the probability that a randomly selected student comes to school using a bicycle on that day? [2 marks]
Show answer and solution
Probability = .
New bicycle users = 50% of 120 = 60. Total bicycle users that day = 50 + 60 = 110. The total remains 200.
Total number of equally likely outcomes = 200.
Number of favourable outcomes = 110.
P(E) = .
P(E) = = .
OR
(iii)(B) What is the probability that a randomly selected student prefers to be dropped off by car? [2 marks]
Show answer and solution
Probability = .
Use the original preferences for this alternative. Car users = 200 − (120 + 50 + 20) = 10.
Total number of equally likely outcomes = 200.
Number of favourable outcomes = 10.
P(E) = .
P(E) = = .
Basic4 marks · 1 + 1 + 2
Case 7. Blood-group and Rhesus percentages
One of four main blood types can be found in a human body. They are known as A, B, AB and O. Each blood type can be further classified as either a Rhesus positive (+) or Rhesus negative (−). For example, a possible combination is blood type O and Rhesus negative which is written as O−.
The data below shows the distribution of the blood types and Rhesus types of given blood type for a Blood Donation Center recorded (in percentages) for the year 2023.
Illustration retained from the official paper.
Data given in the question
Blood group
Rhesus factor
Persons (%)
O
O−
x
O
O+
30
A
A−
8
A
A+
24
B
B−
6
B
B+
18
AB
AB−
1
AB
AB+
3
Describe the figure
The original blood-donation illustration is retained. The table entries are percentages: O− x, O+ 30, A− 8, A+ 24, B− 6, B+ 18, AB− 1 and AB+ 3. Their total must be 100%.
Appeared in: 2025–26 · Basic · Official Sample
(i) Find the value of x. [1 mark]
Show answer and solution
x = 10.
Known percentages total 30 + 8 + 24 + 6 + 18 + 1 + 3 = 90.
x = 100 − 90 = 10.
(ii) Find the probability that a randomly selected person has a Rhesus negative blood type. [1 mark]
(iii)(A) What is the probability that the person selected from the record is Rhesus positive but neither blood type A nor B? [2 marks]
Show answer and solution
Probability = .
Rhesus positive and neither A nor B means O+ or AB+.
Combined percentage = 30% + 3% = 33%.
Required probability = .
OR
(iii)(B) People with blood type AB positive (AB+) are known as the universal recipient and with blood type O negative (O−) are known as universal donor. Find the probability of a selected person to be neither universal recipient nor universal donor. [2 marks]
Show answer and solution
Probability = .
Using the labels stated in this question, the excluded groups are AB+ and O−.
Their combined percentage is 3% + 10% = 13%.
P(neither) = 1 − = .
Numbered draws and overlapping events
Standard4 marks · 1 + 2 + 1
Case 8. Eight Ball: numbered pool balls
“Eight Ball” is a game played on a pool table with 15 balls numbered 1 to 15 and a “cue ball” that is solid and white. Of the 15 numbered balls, eight are solid (non-white) coloured and numbered 1 to 8 and seven are striped balls numbered 9 to 15.
The 15 numbered pool balls (no cue ball) are placed in a large bowl and mixed, then one ball is drawn out at random.
Photograph retained from the official paper.
Describe the figure
The pool-table photograph is retained. The draw uses only the 15 numbered balls; the white cue ball is excluded. Solid coloured balls are numbered 1–8.
Appeared in: 2023 · Standard · Main
(i) What is the probability that the drawn ball bears number 8? [1 mark]
Show answer and solution
Probability = .
Exactly one numbered ball bears 8.
Total number of equally likely outcomes = 15.
Number of favourable outcomes = 1.
P(E) = .
P(E) = = .
(ii)(a) What is the probability that the drawn ball bears an even number? [2 marks]
Show answer and solution
Probability = .
The even numbers are 2, 4, 6, 8, 10, 12 and 14.
Total number of equally likely outcomes = 15.
Number of favourable outcomes = 7.
P(E) = .
P(E) = = .
OR
(ii)(b) What is the probability that the drawn ball bears a number, which is a multiple of 3? [2 marks]
Show answer and solution
Probability = .
The multiples of 3 are 3, 6, 9, 12 and 15.
Total number of equally likely outcomes = 15.
Number of favourable outcomes = 5.
P(E) = .
P(E) = = .
(iii) What is the probability that the drawn ball is a solid coloured and bears an even number? [1 mark]
Show answer and solution
Probability = .
Solid coloured and even means 2, 4, 6 or 8. The question does not restrict the draw to solid balls; all 15 remain possible.
Total number of equally likely outcomes = 15.
Number of favourable outcomes = 4.
P(E) = .
P(E) = = .
Basic4 marks · 1 + 1 + 2 · Accessible paper
Case 9. Selecting a class monitor by drawing a name
There are 60 students in class X of a school of which 45 are girls and 15 are boys. The class teacher has to select one student as a monitor. She writes the name of each student on a separate card and then mixes these cards after putting them in a box. She then draws a card at random from the box.
The accessible source is text-only. There is one name card per student, so there are 60 possible cards.
Appeared in: 2023 · Basic · Supplementary
(i) What is the probability that the name on the selected card is of a girl student? [1 mark]
Show answer and solution
Probability = .
There are 45 girl students and one card for each.
Total number of equally likely outcomes = 60.
Number of favourable outcomes = 45.
P(E) = .
P(E) = = .
(ii) What is the probability that the name on the selected card is of a boy student? [1 mark]
Show answer and solution
Probability = .
There are 15 boy students and one card for each.
Total number of equally likely outcomes = 60.
Number of favourable outcomes = 15.
P(E) = .
P(E) = = .
(iii)(a) If there is one name Shivani, written on a card, what is the probability of her selection? [2 marks]
Show answer and solution
Probability = .
Exactly one of the 60 cards has Shivani’s name.
Total number of equally likely outcomes = 60.
Number of favourable outcomes = 1.
P(E) = .
P(E) = = .
OR
(iii)(b) What is the probability that one out of Ravi, Mahesh or Vikas is selected? [2 marks]
Show answer and solution
Probability = .
The three named students correspond to three different cards.
Total number of equally likely outcomes = 60.
Number of favourable outcomes = 3.
P(E) = .
P(E) = = .
Standard4 marks · 1 + 1 + 2
Case 10. BINGO: the first draw and a grouped results table
BINGO is game of chance. The host has 75 balls numbered 1 through 75. Each player has a BINGO card with some numbers written on it. The participant cancels the number on the card when called out a number written on the ball selected at random. Whosoever cancels all the numbers on his/her card, says BINGO and wins the game.
The table given below shows the data of one such game where 48 balls were used before Tara said ‘BINGO’.
Illustration retained from the official paper.
Data given in the question
Numbers announced
Number of times
0–15
8
15–30
9
30–45
10
45–60
12
60–75
9
Describe the figure
The original BINGO illustration is retained. The grouped table describes the 48 announced numbers. The first-draw probability uses all 75 balls numbered 1 through 75, rather than the table’s 48 observations.
Appeared in: 2024 · Standard · Main
Shared complete case: also on Statistics Case Study PYQs. Probability focus: identify the 75-ball sample space before counting even-numbered balls. The 48-number results table describes later data. All median and mode parts remain here to preserve the complete original case.
(i) Write the median class. [1 mark]
Show answer and solution
Median class = 30–45.
n = 48; = 24.
Working: cumulative frequencies
Class interval
Frequency fᵢ
Cumulative frequency
0–15
8
8
15–30
9
17
30–45
10
27
45–60
12
39
60–75
9
48
The first cumulative frequency greater than 24 is 27.
Median class = 30–45.
(ii) When first ball was picked up, what was the probability of calling out an even number? [1 mark]
Show answer and solution
Probability = .
The even numbers are 2, 4, 6, …, 74: there are 37.
There are 75 possible balls on the first draw.
P(even number) = .
(iii)(a) Find median of the given data. [2 marks]
Show answer and solution
Median = 40.5.
n = 48; = 24.
Working: cumulative frequencies
Class interval
Frequency fᵢ
Cumulative frequency
0–15
8
8
15–30
9
17
30–45
10
27
45–60
12
39
60–75
9
48
The first cumulative frequency greater than 24 is 27.
Median class = 30–45.
Here l = 30, cf = 17, f = 10 and h = 15.
Median = l + × h.
Median = 30 + × 15.
Median = 40.5.
OR
(iii)(b) Find mode of the given data. [2 marks]
Show answer and solution
Mode = 51.
The greatest frequency is 12, so the modal class is 45–60.
Here l = 45, h = 15, f₁ = 12, f₀ = 10 and f₂ = 9.
Mode = l + × h.
Mode = 45 + × 15.
Mode = 51.
Standard4 marks · 1 + 1 + 2
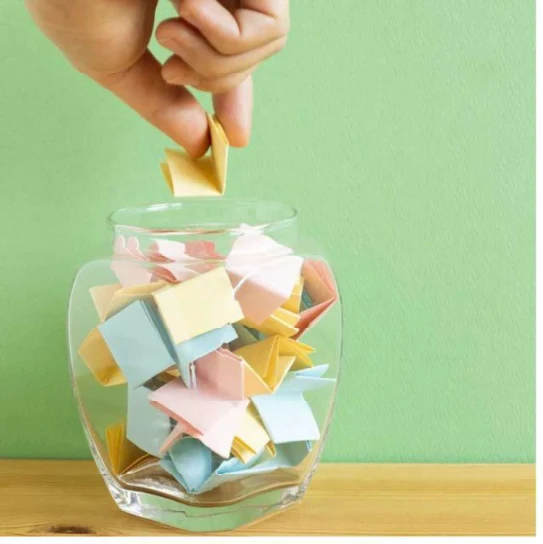
Case 11. Rahul’s jar of numbered cards
Rahul is a lucky charm for his cricket team. He has a jar of cards with numbers from 10 to 74. Before each match, he draws a card from the jar. If the card bears an even number, the team wins. If the number is even and divisible by 5, they win by a big margin. If the number is an odd number less than 30, they win by a small margin. And if the number is a prime number between 50 and 74, they lose.
Photograph retained from the official paper.
Answer the following questions if Rahul draws a card today:
Describe the figure
The original numbered-card jar photograph is retained. Count every integer from 10 through 74 once: 74 − 10 + 1 = 65 cards. The match outcomes are the story’s rules, not a prediction about actual cricket results.
Appeared in: 2025 · Standard · Main
(i) What is the probability that Rahul draws a card with an even number? [1 mark]
Show answer and solution
Probability = .
Even cards are 10, 12, …, 74: count = (74 − 10)/2 + 1 = 33.
Total number of equally likely outcomes = 65.
Number of favourable outcomes = 33.
P(E) = .
P(E) = = .
(ii) What is the probability that Rahul draws a card with an odd number less than 30? [1 mark]
Show answer and solution
Probability = .
The qualifying cards are 11, 13, 15, 17, 19, 21, 23, 25, 27 and 29.
Total number of equally likely outcomes = 65.
Number of favourable outcomes = 10.
P(E) = .
P(E) = = .
(iii)(a) What is the probability that Rahul draws a card with a prime number between 50 and 74? [2 marks]
Show answer and solution
Probability = .
The qualifying primes are 53, 59, 61, 67, 71 and 73.
Total number of equally likely outcomes = 65.
Number of favourable outcomes = 6.
P(E) = .
P(E) = = .
OR
(iii)(b) What is the probability that Rahul draws a card with an even number divisible by 5? [2 marks]
Show answer and solution
Probability = .
An even number divisible by 5 is a multiple of 10: 10, 20, 30, 40, 50, 60 and 70.
Total number of equally likely outcomes = 65.
Number of favourable outcomes = 7.
P(E) = .
P(E) = = .
Basic4 marks · 1 + 1 + 2
Case 12. A school lucky draw with overlapping categories
A school conducted a lucky draw during its annual function. The draw box contained 100 chits, each with a unique number from 1 to 100. The distribution of the chits is as follows:
— 30 chits had red markings. — 20 chits were having numbers which are multiples of 5. — 15 chits had both red markings and numbers which are multiples of 5. — The rest were plain having no marking and no number.
One chit is drawn at random from the box.
The source is text-only. Use 100 chits, red total 30, multiples-of-5 total 20 and overlap 15. The printed last bullet calls the rest unnumbered despite the opening sentence numbering all chits; the official scheme uses the stated category counts.
Appeared in: 2026 · Basic · Second Board Examination
Source wording note: the opening numbers every chit, but the last bullet says the remaining chits have no number. The solutions follow the category counts used in CBSE’s schemes: 2026 Basic second board, 430/8/1 PDF p. 19; 430/8/2 p. 17; 430/8/3 p. 16.
(i) What are the total number of outcomes? [1 mark]
Show answer and solution
Total number of outcomes = 100.
Each chit is one possible outcome.
There are 100 chits in the draw box.
(ii) What is the probability that the chit drawn has a red marking only? [1 mark]
Show answer and solution
Probability = .
Red only = 30 − 15 = 15; remove the 15 chits that also have a multiple of 5.
Total number of equally likely outcomes = 100.
Number of favourable outcomes = 15.
P(E) = .
P(E) = = .
(iii)(a) What is the probability that the chit has a multiple of 5 but no red marking? [2 marks]
Show answer and solution
Probability = .
Multiple of 5 only = 20 − 15 = 5.
Total number of equally likely outcomes = 100.
Number of favourable outcomes = 5.
P(E) = .
P(E) = = .
OR
(iii)(b) What is the probability that the chit drawn is neither of red marking nor a multiple of 5? [2 marks]
Show answer and solution
Probability = .
Red or multiple of 5 = 30 + 20 − 15 = 35. Neither = 100 − 35 = 65.
Total number of equally likely outcomes = 100.
Number of favourable outcomes = 65.
P(E) = .
P(E) = = .
Coloured objects, coins and quality checks
Basic4 marks · 1 + 1 + 2
Case 13. Ashima’s birthday bag of coloured toffees
Aarav and Ashima are brother and sister and on Ashima’s birthday, Aarav gifts her a bag filled with 8 red toffees, 10 green toffees and 6 blue toffees. Ashima decides to randomly draw a toffee from the bag. She wants to find the chances of picking a toffee of specific colour and asks the following questions:
Photograph retained from the official paper.
Describe the figure
The original toffee photograph is retained. Use the stated counts, not the decorative photograph: red 8, green 10 and blue 6; total 24.
Appeared in: 2025 · Basic · Supplementary
(i) What is the probability of getting a green toffee? [1 mark]
Show answer and solution
Probability = .
Total toffees = 8 + 10 + 6 = 24; green toffees = 10.
Total number of equally likely outcomes = 24.
Number of favourable outcomes = 10.
P(E) = .
P(E) = = .
(ii) What is the probability of getting a blue toffee? [1 mark]
Show answer and solution
Probability = .
There are 6 blue toffees.
Total number of equally likely outcomes = 24.
Number of favourable outcomes = 6.
P(E) = .
P(E) = = .
(iii)(a) What is the probability of getting a non-red toffee? [2 marks]
Show answer and solution
Probability = .
Non-red means green or blue: 10 + 6 = 16.
Total number of equally likely outcomes = 24.
Number of favourable outcomes = 16.
P(E) = .
P(E) = = .
OR
(iii)(b) What is the probability of getting a red or a green toffee? [2 marks]
Show answer and solution
Probability = .
Red or green gives 8 + 10 = 18 favourable toffees.
Total number of equally likely outcomes = 24.
Number of favourable outcomes = 18.
P(E) = .
P(E) = = .
Standard4 marks · 2 + 2 · Accessible paper
Case 14. Raghav’s basket: finding an unknown colour count
Raghav has a collection of balls of different colours. He has a total of 35 balls in his basket out of which seven are black in colour and eight are yellow in colour. Out of remaining balls, some are white and the rest are red.
The accessible source is text-only. The remaining 20 balls are white or red; use the probability condition to find their separate counts.
Appeared in: 2026 · Standard · Main
(a) If the probability of drawing a red ball at random from the basket is three times that of a white ball, then find the number of red balls in the basket. [2 marks]
Show answer and solution
Number of red balls = 15.
White and red balls together = 35 − 7 − 8 = 20.
Let the number of white balls be x; red balls = 20 − x.
= 3 × .
20 − x = 3x.
x = 5, so number of red balls = 20 − 5 = 15.
(b) Find the probability of drawing a ball at random from the basket which is either a black or a white ball. [2 marks]
Show answer and solution
Probability = .
From part (a), white balls = 5; black or white gives 7 + 5 = 12 favourable balls.
Total number of equally likely outcomes = 35.
Number of favourable outcomes = 12.
P(E) = .
P(E) = = .
Basic4 marks · 1 + 1 + 2 · Accessible paper
Case 15. Selecting juice cartons and mixed tetrapacks
Sunil goes to a store to purchase juice cartons for his house, as some guests are expected to come. The store has 8 cartons of mango juice, 5 cartons of litchi juice, 3 cartons of apple juice and 2 cartons of banana juice. Each carton contains 5 tetrapacks of the juice.
The accessible source is text-only. Parts (i) and (ii) select from the store’s 18 cartons. In part (iii), use the 5 purchased cartons, containing 25 mixed tetrapacks; both OR alternatives refer to that purchased selection.
Appeared in: 2026 · Basic · Second Board Examination
For part (iii), switch from the shop’s cartons to the purchased mixed tetrapacks. Both OR alternatives use that selection.
(i) If Sunil chooses a carton at random, what is the probability of getting a carton of mango juice? [1 mark]
Show answer and solution
Probability = .
The store has 8 + 5 + 3 + 2 = 18 cartons; 8 are mango.
Total number of equally likely outcomes = 18.
Number of favourable outcomes = 8.
P(E) = .
P(E) = = .
(ii) What is the probability of selecting a carton which is not of apple juice? [1 mark]
Show answer and solution
Probability = .
Non-apple cartons = 18 − 3 = 15.
Total number of equally likely outcomes = 18.
Number of favourable outcomes = 15.
P(E) = .
P(E) = = .
(iii)(a) Sunil buys 2 cartons of mango juice and 1 carton each of litchi, apple and banana juice. He opens them and places all tetrapacks on a table after mixing the packs. Find the probability of selecting a tetrapack of litchi juice or banana juice at random, by a guest. [2 marks]
(iii)(b) Find the probability of selecting a tetrapack of apple juice or banana juice at random, by a guest. [2 marks]
Show answer and solution
Probability = .
Use the same purchased cartons described in part (iii). Apple or banana packs = (1 + 1) × 5 = 10 out of 25 mixed packs.
Total number of equally likely outcomes = 25.
Number of favourable outcomes = 10.
P(E) = .
P(E) = = .
Standard4 marks · 1 + 1 + 2 · Accessible paper
Case 16. A piggy bank with four coin denominations
Deepak decided to count the total number of coins in his piggy bank. After counting, he finds the following:
Data given in the question
Denomination
Number of coins
₹1
40
₹2
48
₹5
36
₹10
26
His friend Anil was asked to take one coin at random from the collection of these coins.
The accessible source has a table but no illustration. There are 40 ₹1 coins, 48 ₹2 coins, 36 ₹5 coins and 26 ₹10 coins: 150 individual coins. Selection is by coin, not by rupee value.
Appeared in: 2026 · Standard · Second Board Examination
(i) Find the probability of drawing a ₹5 coin. [1 mark]
(ii) Find the probability of drawing a ₹5 or a ₹10 coin. [1 mark]
Show answer and solution
Probability = .
Favourable coins = 36 + 26 = 62.
Total number of equally likely outcomes = 150.
Number of favourable outcomes = 62.
P(E) = .
P(E) = = .
(iii)(a) What is the probability of not drawing a ₹10 coin? [2 marks]
Show answer and solution
Probability = .
Non-₹10 coins = 150 − 26 = 124.
Total number of equally likely outcomes = 150.
Number of favourable outcomes = 124.
P(E) = .
P(E) = = .
OR
(iii)(b) What is the probability of not drawing a ₹1 coin? [2 marks]
Show answer and solution
Probability = .
Non-₹1 coins = 150 − 40 = 110.
Total number of equally likely outcomes = 150.
Number of favourable outcomes = 110.
P(E) = .
P(E) = = .
Basic4 marks · 1 + 1 + 2
Case 17. Printed T-shirts: good, minor-defect and major-defect
A labourer prints 400 T-shirts in a day. The supervisor checked the T-shirts and found that 312 prints were good, 54 prints were with minor defects and rest of the prints were of major defects.
Photograph retained from the official paper.
Harish, a customer will buy a T-shirt only if it is good but a trader will buy, if it has no major defect. If a random T-shirt is picked, then
Describe the figure
The original garment-workshop photograph is retained. Good prints: 312; minor defects: 54; major defects: 400 − 312 − 54 = 34. The trader accepts both good and minor-defect prints.
Appeared in: 2026–27 · Basic · Official Sample
(i) Find the probability that Harish will buy a T-shirt. [1 mark]
Show answer and solution
Probability = .
Harish accepts only the 312 good prints.
Total number of equally likely outcomes = 400.
Number of favourable outcomes = 312.
P(E) = .
P(E) = = .
(ii) Find the probability that a trader will buy the T-shirt. [1 mark]
Show answer and solution
Probability = .
No major defect includes good and minor-defect prints: 312 + 54 = 366.
Total number of equally likely outcomes = 400.
Number of favourable outcomes = 366.
P(E) = .
P(E) = = .
(iii)(A) Find the probability that the T-shirt is not good. [2 marks]
Show answer and solution
Probability = .
Not good includes minor and major defects: 400 − 312 = 88.
Total number of equally likely outcomes = 400.
Number of favourable outcomes = 88.
P(E) = .
P(E) = = .
OR
(iii)(B) Find the probability that neither Harish nor trader buy the T-shirt. [2 marks]
Show answer and solution
Probability = .
Both refuse only a major-defect print. Major defects = 400 − 312 − 54 = 34.
Total number of equally likely outcomes = 400.
Number of favourable outcomes = 34.
P(E) = .
P(E) = = .
Spinners and altered card packs
Standard4 marks · 1 + 1 + 2
Case 18. Making purple: two spinners and a school fundraiser
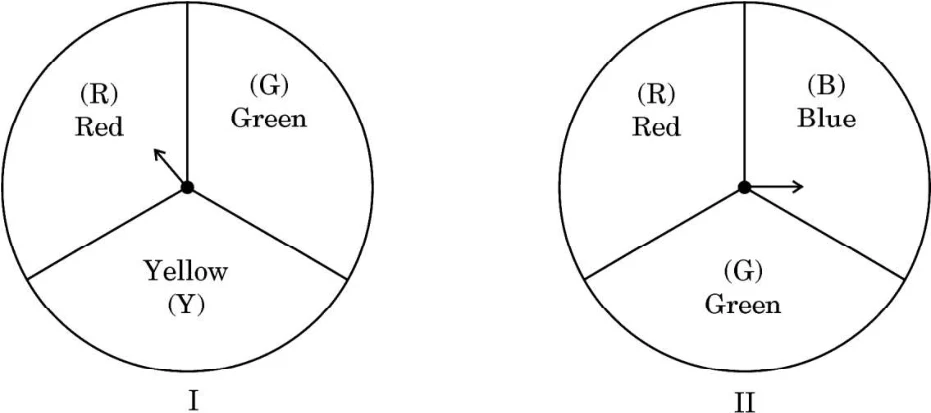
A middle school decided to run the following spinner game as a fund-raiser on Christmas Carnival.
Diagram retained from the official paper.
Making Purple: Spin each spinner once. Blue and red make purple. So, if one spinner shows Red (R) and another Blue (B), then you “win”. One such outcome is written as ‘RB’.
Based on the above, answer the following questions:
Describe the figure
Spinner I has equal sectors Red (R), Green (G) and Yellow (Y). Spinner II has equal sectors Red (R), Blue (B) and Green (G). Write the first spinner’s result first. Only RB makes purple: spinner I has no blue sector.
Appeared in: 2023 · Standard · Main
The collection answers use the expected number of wins, as in the official scheme; a random game need not produce those exact counts.
(i) List all possible outcomes of the game. [1 mark]
Show answer and solution
Outcomes: RR, RB, RG, GR, GB, GG, YR, YB, YG.
Possible outcomes: spinner I first
I / II
R
B
G
R
RR
RB
RG
G
GR
GB
GG
Y
YR
YB
YG
Choose one of R, G, Y from spinner I and one of R, B, G from spinner II.
There are 3 × 3 = 9 equally likely ordered outcomes.
(ii) Find the probability of ‘Making Purple’. [1 mark]
Show answer and solution
Probability = .
The only winning outcome is RB; BR is not possible because spinner I has no blue sector.
Total number of equally likely outcomes = 9.
Number of favourable outcomes = 1.
P(E) = .
P(E) = = .
(iii)(a) For each win, a participant gets ₹10, but if he/she loses, he/she has to pay ₹5 to the school. If 99 participants played, calculate how much fund could the school have collected. [2 marks]
Show answer and solution
Expected net collection = ₹330.
P(win) = and P(loss) = .
Expected winners = 99 × = 11.
Expected losers = 99 − 11 = 88.
Expected receipts = 88 × ₹5 = ₹440.
Expected payouts = 11 × ₹10 = ₹110.
Expected net collection = ₹440 − ₹110 = ₹330.
The marking scheme uses 11 winners and 88 losers. These are expected counts; actual results of 99 random plays need not be exactly 11 wins.
OR
(iii)(b) If the same amount of ₹5 has been decided for winning or losing the game, then how much fund had been collected by school? (Number of participants = 99) [2 marks]
Show answer and solution
Expected net collection = ₹385.
Use the expected counts of 11 winners and 88 losers.
Expected net collection = 88 × ₹5 − 11 × ₹5.
Expected net collection = ₹440 − ₹55 = ₹385.
As in the official scheme, this is the expected collection, not a guarantee for a particular set of 99 plays.
Standard4 marks · 1 + 1 + 2
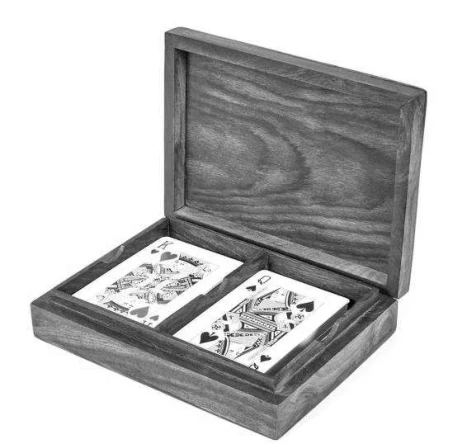
Case 19. Two card packs after three cards are dropped
A group of friends wanted to play cards with two identical packs together. While shuffling the cards, three cards are dropped. Rest of the cards are shuffled and one card is drawn at random. Assuming that the dropped cards were a queen of hearts, a ten of spades and an ace of clubs, answer the following questions:
Photograph retained from the official paper.
Describe the figure
The original card-box photograph is retained. Two standard packs contain 104 cards. Exactly one queen, one ten and one ace are removed, leaving 101 cards. Only the removed queen is a face card.
Appeared in: 2026 · Standard · Main
(i) Find the probability that the drawn card is a face card. [1 mark]
Show answer and solution
Probability = .
Two packs have 2 × 12 = 24 face cards. The queen of hearts is removed, leaving 23 face cards.
Total number of equally likely outcomes = 101.
Number of favourable outcomes = 23.
P(E) = .
P(E) = = .
(ii) Find the probability that the drawn card is either a king or a queen. [1 mark]
Show answer and solution
Probability = .
There are 8 kings and 8 − 1 = 7 queens left: favourable count = 15.
Total number of equally likely outcomes = 101.
Number of favourable outcomes = 15.
P(E) = .
P(E) = = .
(iii)(a) Do you think that the probability of getting a queen was higher if none of the cards were dropped? Justify your answer. [2 marks]
Show answer and solution
Yes: > .
Before any cards were dropped, there were 8 queens among 104 cards.
After the three specified removals, there are 7 queens among 101 cards.
The probability of a queen was higher before the cards were dropped.
OR
(iii)(b) Find the probability that the drawn card is a jack. Compare it with the probability when none of the cards were dropped. In which case is the probability of getting a jack higher? [2 marks]
Show answer and solution
After removal: ; before removal: . Higher after removal.
No jack is removed, so all 8 jacks remain.
P(jack after removal) = .
P(jack before removal) = .
For the same positive numerator, the smaller denominator gives the larger fraction.
Therefore, > : higher after removal.
Questions students ask
How do I choose the denominator in a Probability case study?
Identify what is selected and count all individual objects that can be selected at that stage. In the BINGO case, the first draw has 75 possible balls; the later table of 48 called numbers describes different data.
Does “or” always mean I can add the two counts?
Add counts directly only when the categories do not overlap. For red-marked chits and multiples of 5, subtract the overlap once. The lucky-draw case has 30 + 20 − 15 = 35 chits in either category.
What is the difference between “neither” and “not both”?
Neither A nor B excludes both categories, so take the complement of A or B. Not both excludes only their overlap. They describe different events; read the question’s words before counting.
How do I use a pie chart to find a probability?
Divide the relevant sector angle by 360°. Add sector angles for non-overlapping categories. Use a labelled angle or supplied information; do not measure an unlabelled sector from a small printed drawing.
Do I count both endpoints in a numbered-card range?
Yes when the cards run from the first stated integer through the last. Cards 10 to 74 give 74 − 10 + 1 = 65 outcomes. Apply stricter words such as “less than” separately when counting favourable cards.
Why does removing cards sometimes increase a probability?
Check both numerator and denominator. Removing no jacks leaves 8 jacks but reduces two packs from 104 to 101 cards, so 8/101 exceeds 8/104. Removing a queen also reduces the number of queens, so that event needs a separate comparison.
Why is the spinner fundraiser answer an expected collection?
The official scheme uses 99 × 1/9 = 11 wins and 88 losses. These are expected counts based on equally likely spinner outcomes. A particular group of 99 players may produce a different number of wins, so the actual collection can differ.
Can I count objects from a decorative photograph?
Use the quantities stated in the passage. A toffee photograph illustrates the situation but does not replace the stated 8 red, 10 green and 6 blue toffees. The pie charts and spinner diagrams carry mathematical data and must be read.
What should I do when a later subpart changes the selection?
Rebuild the possible outcomes for that part. The juice case changes from 18 shop cartons to 25 purchased tetrapacks. In the school-travel sample, 60 walkers switch to bicycles for one alternative; the other alternative uses the original preferences.
Do I answer both OR alternatives?
Answer one alternative where OR is printed in the examination. Both are solved here for practice. Follow the marks shown beside each part; the accessible coloured-ball case uses 2 + 2 rather than 1 + 1 + 2.
Can the probability of an event be greater than 1?
No. A probability lies between 0 and 1 inclusive. For equally likely outcomes, the favourable outcomes form part of the full sample space, so their count cannot exceed the total. If your fraction exceeds 1, recheck the event count and denominator.
Official sources — View papers and marking schemesCase 1 sources
2023 · Basic · main · 430/1/1 · Q38 — Official question-paper archive · Official marking schemeQuestion file: MATHEMATICS_BASIC/430_1_1_Maths Basic.pdf Marking-scheme file: Math_Basic/430_1_1.pdf Question PDF page 23; marking-scheme PDF page 19.
2023 · Basic · main · 430/1/2 · Q36 — Official question-paper archive · Official marking schemeQuestion file: MATHEMATICS_BASIC/430_1_2_Maths Basic.pdf Marking-scheme file: Math_Basic/430_1_2.pdf Question PDF page 19; marking-scheme PDF page 16.
2023 · Basic · main · 430/1/3 · Q37 — Official question-paper archive · Official marking schemeQuestion file: MATHEMATICS_BASIC/430_1_3_Maths Basic.pdf Marking-scheme file: Math_Basic/430_1_3.pdf Question PDF page 21; marking-scheme PDF page 17.
Case 2 sources
2023 · Basic · main · 430/5/1 · Q38 — Official question-paper archive · Official marking schemeQuestion file: MATHEMATICS_BASIC/430_5_1_Maths Basic.pdf Marking-scheme file: Math_Basic/430_5_1.pdf Question PDF page 23; marking-scheme PDF page 18.
2023 · Basic · main · 430/5/2 · Q37 — Official question-paper archive · Official marking schemeQuestion file: MATHEMATICS_BASIC/430_5_2_Maths Basic.pdf Marking-scheme file: Math_Basic/430_5_2.pdf Question PDF page 21; marking-scheme PDF page 16.
2023 · Basic · main · 430/5/3 · Q38 — Official question-paper archive · Official marking schemeQuestion file: MATHEMATICS_BASIC/430_5_3_Maths Basic.pdf Marking-scheme file: Math_Basic/430_5_3.pdf Question PDF page 23; marking-scheme PDF page 15.
Case 3 sources
2023 · Standard · main · 30/2/1 · Q38 — Official question-paper archive · Official marking schemeQuestion file: MATHEMATICS_STANDARD/30_2_1_Maths Standard.pdf Marking-scheme file: Maths_Standard/MS 041_30-2-1 Mathematics 2022-23.pdf Question PDF page 23; marking-scheme PDF page 20.
2023 · Standard · main · 30/2/2 · Q36 — Official question-paper archive · Official marking schemeQuestion file: MATHEMATICS_STANDARD/30_2_2_Maths Standard.pdf Marking-scheme file: Maths_Standard/MS 041_30-2-2 Mathematics 2022-23.pdf Question PDF page 21; marking-scheme PDF page 18.
2023 · Standard · main · 30/2/3 · Q37 — Official question-paper archive · Official marking schemeQuestion file: MATHEMATICS_STANDARD/30_2_3_Maths Standard.pdf Marking-scheme file: Maths_Standard/MS 041_30-2-3 Mathematics 2022-23.pdf Question PDF page 21; marking-scheme PDF page 19.
Case 4 sources
2024 · Standard · main · 30/2/1 · Q38 — Official question-paper archive · Official marking schemeQuestion file: MATHEMATICS_STANDARD/30-2-1(Mathematics Standard).pdf Marking-scheme file: Mathematics_Standard/MS 041_30-2-1 Mathematics 2023-24.pdf Question PDF page 23; marking-scheme PDF page 22.
2024 · Standard · main · 30/2/2 · Q36 — Official question-paper archive · Official marking schemeQuestion file: MATHEMATICS_STANDARD/30-2-2(Mathematics Standard).pdf Marking-scheme file: Mathematics_Standard/MS 041_30-2-2 Mathematics 2023-24.pdf Question PDF pages 21, 23; marking-scheme PDF pages 20, 21.
2024 · Standard · main · 30/2/3 · Q36 — Official question-paper archive · Official marking schemeQuestion file: MATHEMATICS_STANDARD/30-2-3(Mathematics Standard).pdf Marking-scheme file: Mathematics_Standard/MS 041_30-2-3 Mathematics 2023-24.pdf Question PDF page 21; marking-scheme PDF pages 21, 22.
Case 5 sources
2024 · Basic · main · 430/5/1 · Q36 — Official question-paper archive · Official marking schemeQuestion file: MATHEMATICS_BASIC/430-5-1MATHEMATICS (BASIC).pdf Marking-scheme file: Mathematics/X_241_MS_430_5_1_Unsigned.pdf Question PDF pages 19, 21; marking-scheme PDF page 17.
2024 · Basic · main · 430/5/2 · Q38 — Official question-paper archive · Official marking schemeQuestion file: MATHEMATICS_BASIC/430-5-2MATHEMATICS (BASIC).pdf Marking-scheme file: Mathematics/X_241_MS_430_5_2_Unsigned.pdf Question PDF page 23; marking-scheme PDF page 20.
2024 · Basic · main · 430/5/3 · Q37 — Official question-paper archive · Official marking schemeQuestion file: MATHEMATICS_BASIC/430-5-3MATHEMATICS (BASIC).pdf Marking-scheme file: Mathematics/X_241_MS_430_5_3_Unsigned.pdf Question PDF page 21; marking-scheme PDF page 19.
Case 6 sources
2024–25 · Basic · Official sample · Q36 — Official sample question paper · Official marking schemeQuestion file: MathsBasic-SQP.pdf Marking-scheme file: MathsBasic-MS.pdf Question PDF pages 6, 7; marking-scheme PDF pages 6, 7.
Case 7 sources
2025–26 · Basic · Official sample · Q38 — Official sample question paper · Official marking schemeQuestion file: MathsBasic-SQP.pdf Marking-scheme file: MathsBasic-MS.pdf Question PDF page 11; marking-scheme PDF page 11.
Case 8 sources
2023 · Standard · main · 30/6/1 · Q38 — Official question-paper archive · Official marking schemeQuestion file: MATHEMATICS_STANDARD/30_6_1_Maths Standard.pdf Marking-scheme file: Maths_Standard/MS 041_30-6-1 Mathematics 2022-23.pdf Question PDF page 23; marking-scheme PDF pages 22, 23.
2023 · Standard · main · 30/6/2 · Q36 — Official question-paper archive · Official marking schemeQuestion file: MATHEMATICS_STANDARD/30_6_2_Maths Standard.pdf Marking-scheme file: Maths_Standard/MS 041_30-6-2 Mathematics 2022-23.pdf Question PDF page 19; marking-scheme PDF pages 20, 21.
2023 · Standard · main · 30/6/3 · Q37 — Official question-paper archive · Official marking schemeQuestion file: MATHEMATICS_STANDARD/30_6_3_Maths Standard.pdf Marking-scheme file: Maths_Standard/MS 041_30-6-3 Mathematics 2022-23.pdf Question PDF page 21; marking-scheme PDF pages 20, 21.
Case 9 sources
2023 · Basic · supplementary · 430(B) · Q38 — Official question-paper archive · Official marking schemeQuestion file: Maths_Basic/430_C_B Mathematics Basic.pdf Marking-scheme file: Mathematics_Basic/241_C_B.pdf Question PDF page 23; marking-scheme PDF page 12.
Case 10 sources
2024 · Standard · main · 30/1/1 · Q37 — Official question-paper archive · Official marking schemeQuestion file: MATHEMATICS_STANDARD/30-1-1(Mathematics Standard).pdf Marking-scheme file: Mathematics_Standard/MS 041_30-1-1 Mathematics 2023-24.pdf Question PDF pages 13, 15; marking-scheme PDF page 17.
2024 · Standard · main · 30/1/2 · Q36 — Official question-paper archive · Official marking schemeQuestion file: MATHEMATICS_STANDARD/30-1-2(Mathematics Standard).pdf Marking-scheme file: Mathematics_Standard/MS 041_30-1-2 Mathematics 2023-24.pdf Question PDF pages 11, 13; marking-scheme PDF page 16.
2024 · Standard · main · 30/1/3 · Q37 — Official question-paper archive · Official marking schemeQuestion file: MATHEMATICS_STANDARD/30-1-3(Mathematics Standard).pdf Marking-scheme file: Mathematics_Standard/MS 041_30-1-3 Mathematics 2023-24.pdf Question PDF pages 13, 15; marking-scheme PDF pages 16, 17.
Case 11 sources
2025 · Standard · main · 30/2/1 · Q37 — Official question-paper archive · Official marking schemeQuestion file: 041_Mathematics_Standard/30-2-1_Mathematics Standard.pdf Marking-scheme file: Math/041 Mathematics Standard/X_MS_041_Mathematics Standard_30-2-1_2024-25.pdf Question PDF page 25; marking-scheme PDF page 17.
2025 · Standard · main · 30/2/2 · Q36 — Official question-paper archive · Official marking schemeQuestion file: 041_Mathematics_Standard/30-2-2_Mathematics Standard.pdf Marking-scheme file: Math/041 Mathematics Standard/X_MS_041_Mathematics Standard_30-2-2_2024-25.pdf Question PDF page 23; marking-scheme PDF page 17.
2025 · Standard · main · 30/2/3 · Q38 — Official question-paper archive · Official marking schemeQuestion file: 041_Mathematics_Standard/30-2-3_Mathematics Standard.pdf Marking-scheme file: Math/041 Mathematics Standard/X_MS_041_Mathematics Standard_30-2-3_2024-25.pdf Question PDF page 27; marking-scheme PDF pages 18, 19.
Case 12 sources
2026 · Basic · second board examination · 430/8/1 · Q38 — Official question-paper archive · Official marking schemeQuestion file: Mathmatics_Basic/430-8-1_Maths Basic_E2_10_2026.pdf Marking-scheme file: Mathematics_Basic/241_430_8_1 Mathematics Basic.pdf Question PDF page 23; marking-scheme PDF page 19.
2026 · Basic · second board examination · 430/8/2 · Q37 — Official question-paper archive · Official marking schemeQuestion file: Mathmatics_Basic/430-8-2_Maths Basic_E2_10_2026.pdf Marking-scheme file: Mathematics_Basic/241_430_8_2 Mathematics Basic.pdf Question PDF pages 21, 23; marking-scheme PDF page 17.
2026 · Basic · second board examination · 430/8/3 · Q36 — Official question-paper archive · Official marking schemeQuestion file: Mathmatics_Basic/430-8-3_Maths Basic_E2_10_2026.pdf Marking-scheme file: Mathematics_Basic/241_430_8_3 Mathematics Basic.pdf Question PDF page 21; marking-scheme PDF page 16.
Case 13 sources
2025 · Basic · supplementary · 430/S/1 · Q38 — Official question-paper archive · Official marking schemeQuestion file: Maths_Basic/430-S-1Math Basic.pdf Marking-scheme file: MATHEMATICS_BASIC/MS_X_Mathematics(Basic)_241_430_S_1.pdf Question PDF page 23; marking-scheme PDF page 21.
2025 · Basic · supplementary · 430/S/2 · Q38 — Official question-paper archive · Official marking schemeQuestion file: Maths_Basic/430-S-2Math Basic.pdf Marking-scheme file: MATHEMATICS_BASIC/MS_X_Mathematics(Basic)_241_430_S_2.pdf Question PDF page 23; marking-scheme PDF page 21.
2025 · Basic · supplementary · 430/S/3 · Q36 — Official question-paper archive · Official marking schemeQuestion file: Maths_Basic/430-S-3Math Basic.pdf Marking-scheme file: MATHEMATICS_BASIC/MS_X_Mathematics(Basic)_241_430_S_3.pdf Question PDF page 19; marking-scheme PDF page 19.
2026 · Basic · second board examination · 430(B) · Q38 — Official question-paper archive · Official marking schemeQuestion file: Mathmatics_Basic/430-B_Maths Basic_E2_10_2026.pdf Marking-scheme file: Mathematics_Basic/Mathematics Basic-241 E2 430(B).pdf Question PDF page 23; marking-scheme PDF page 17.
Case 16 sources
2026 · Standard · second board examination · 30(B) · Q38 — Official question-paper archive · Official marking schemeQuestion file: Mathmatics_Std/30-B_Maths Std_E2_10_2026.pdf Marking-scheme file: Mathematics_Standard/MS_X_041_Mathematics_30B_II_Board_2025-26.pdf Question PDF page 23; marking-scheme PDF page 20.
Case 17 sources
2026–27 · Basic · Official sample · Q38 — Official sample question paper · Official marking schemeQuestion file: MathsBasic-SQP.pdf Marking-scheme file: MathsBasic-MS.pdf Question PDF page 8; marking-scheme PDF page 11.
Case 18 sources
2023 · Standard · main · 30/5/1 · Q37 — Official question-paper archive · Official marking schemeQuestion file: MATHEMATICS_STANDARD/30_5_1_Maths Standard.pdf Marking-scheme file: Maths_Standard/MS 041_30-5-1 Mathematics 2022-23.pdf Question PDF page 23; marking-scheme PDF pages 26, 27.
2023 · Standard · main · 30/5/2 · Q36 — Official question-paper archive · Official marking schemeQuestion file: MATHEMATICS_STANDARD/30_5_2_Maths Standard.pdf Marking-scheme file: Maths_Standard/MS 041_30-5-2 Mathematics 2022-23.pdf Question PDF page 21; marking-scheme PDF pages 25, 26.
2023 · Standard · main · 30/5/3 · Q38 — Official question-paper archive · Official marking schemeQuestion file: MATHEMATICS_STANDARD/30_5_3_Maths Standard.pdf Marking-scheme file: Maths_Standard/MS 041_30-5-3 Mathematics 2022-23.pdf Question PDF page 25; marking-scheme PDF pages 28, 29.