Statistics Case Study Questions Class 10: CBSE PYQs with Answers
Practise 21 Class 10 Statistics case-study questions from CBSE previous-year board papers (2022–2026) and the 2026–27 official sample. The cases cover grouped mean, median, mode and cumulative frequency. Read each table, choose the formula and try each part before checking the working. Both OR alternatives are solved for practice.
21 distinct cases · 47 board-paper appearances + 1 official-sample appearance Solutions prepared by Team TutorVertex Verified by Siddharth Sir · Last reviewed 28 October 2026
Key results
What is required?
Relationship
Class mark and total
xᵢ = ; n = Σfᵢ.
Mean: direct method
x̄ = .
Mean: assumed mean
x̄ = a + , where dᵢ = xᵢ − a.
Mean: step deviation
x̄ = a + h, where uᵢ = .
Median
Median = l + × h. Use the first cumulative frequency greater than n/2 to identify its class.
Mode
Mode = l + × h. For the equal-width distributions here, the modal class has the greatest frequency.
Empirical relationship
Mode ≈ 3 Median − 2 Mean. This is an approximate relationship, not an identity for all data.
Here fᵢ is a frequency, xᵢ is a class mark, a is an assumed mean and h is the class size or the scaling value used for step deviation. For median, l is the lower limit of the continuous median class, cf is the cumulative frequency before it and f is its frequency. For mode, l belongs to the modal class; f₁ is its frequency, f₀ the previous frequency and f₂ the next frequency.
Convert inclusive intervals to continuous boundaries when required. Class limits and class boundaries are different quantities. Keep exact values until final rounding. Both OR alternatives are solved for practice; answer one where OR is printed.
Find a case
Showing all 21 cases
No cases match these filters. Try another combination or reset the filters.
Community surveys and transport
Standard4 marks · 2 + 2
Case 1. A yoga camp: median age and an added-person condition
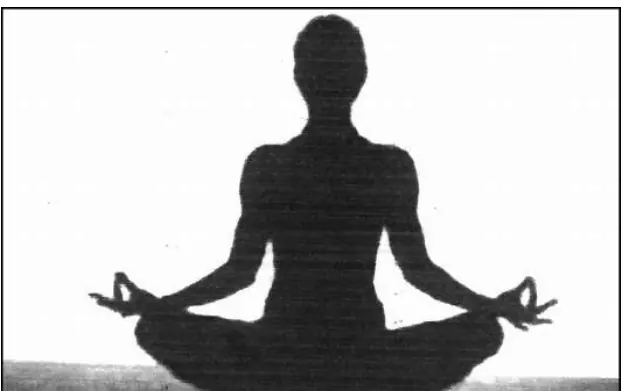
Yoga is an ancient practice which is a form of meditation and exercise. By practising yoga, we not even make our body healthy but also achieve inner peace and calmness. The International Yoga Day is celebrated on 21st of June every year since 2015.
To promote Yoga, Green park society in Pune organised a 7-day Yoga camp in their society. The number of people of different age groups who enrolled for this camp is given as follows:
Photograph retained from the official paper.
Data given in the question
Age group (years)
Number of people
15–25
8
25–35
10
35–45
15
45–55
25
55–65
40
65–75
24
75–85
18
Describe the figure
The original yoga photograph is retained. The age table has 140 people in total. The added-person condition in part (b) must be checked for a whole-number answer.
Appeared in: 2022 · Standard · Main
(a) Find the median age of people enrolled for the camp. [2 marks]
Show answer and solution
Median = 58 years.
n = 140; = 70.
Working: cumulative frequencies
Class interval
Frequency fᵢ
Cumulative frequency
15–25
8
8
25–35
10
18
35–45
15
33
45–55
25
58
55–65
40
98
65–75
24
122
75–85
18
140
The first cumulative frequency greater than 70 is 98.
Median class = 55–65.
Here l = 55, cf = 58, f = 40 and h = 10.
Median = l + × h.
Median = 55 + × 10.
Median = 58 years.
(b) If x more people of age group 65–75 had enrolled for the camp, the mean age would have been 58. Find the value of x. [2 marks]
Show answer and solution
No whole-number value satisfies the printed data; formal x = .
The original class marks are 20, 30, 40, 50, 60, 70 and 80.
Working: original distribution before adding people
Class interval
fᵢ
xᵢ
fᵢxᵢ
15–25
8
20
160
25–35
10
30
300
35–45
15
40
600
45–55
25
50
1250
55–65
40
60
2400
65–75
24
70
1680
75–85
18
80
1440
Total
140
—
7830
Σfᵢ = 140 and Σfᵢxᵢ = 7830.
The added people are in class 65–75, whose class mark is 70.
New mean = = 58.
7830 + 70x = 8120 + 58x.
12x = 290, so x = ≈ 24.17.
A number of people must be a whole number, so the printed condition has no valid integer solution.
Source note: the 2022 Standard 30/4/1 scheme, PDF and printed p. 11, says an attempted answer “will be awarded full credit of 2 marks”. The fraction above is shown to explain the source issue, not as a valid count of people.
Basic4 marks · 2 + 2
Case 2. Daily distances travelled by public buses
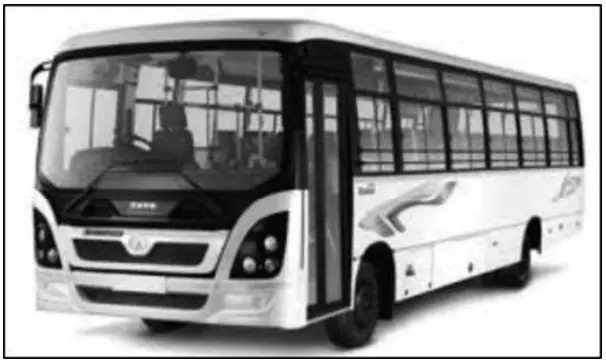
Electric buses are becoming popular nowadays. These buses have the electricity stored in a battery. Electric buses have the range of approximately 280 km with just one charge. These buses are superior to diesel buses as they reduce brake wear and also reduce pollution.
Transport department of a city wants to buy some electric buses for the city. So, the department wants to know the distance travelled by existing public transport buses in a day. The following data shows the distance travelled by 50 existing public transport buses in a day.
Photograph retained from the official paper.
Data given in the question
Daily distance travelled (km)
Number of buses
100–120
12
120–140
14
140–160
8
160–180
6
180–200
10
Describe the figure
The original electric-bus photograph is retained. The grouped table records daily distances in kilometres for 50 existing buses.
Appeared in: 2022 · Basic · Main
(a) Find the median distance travelled by a bus. [2 marks]
Show answer and solution
Median = ≈ 138.57 km.
n = 50; = 25.
Working: cumulative frequencies
Class interval
Frequency fᵢ
Cumulative frequency
100–120
12
12
120–140
14
26
140–160
8
34
160–180
6
40
180–200
10
50
The first cumulative frequency greater than 25 is 26.
Median class = 120–140.
Here l = 120, cf = 12, f = 14 and h = 20.
Median = l + × h.
Median = 120 + × 20.
Median = ≈ 138.57 km.
(b) Find the mean (average) distance travelled by a bus. [2 marks]
Show answer and solution
Mean = 145.2 km.
Class mark xᵢ = .
Working: direct method
Class interval
fᵢ
xᵢ
fᵢxᵢ
100–120
12
110
1320
120–140
14
130
1820
140–160
8
150
1200
160–180
6
170
1020
180–200
10
190
1900
Total
50
—
7260
Total frequency n = Σfᵢ = 50.
Mean x̄ = .
x̄ = = 145.2 km.
Basic4 marks · 2 + 2
Case 3. Museum visitors: a less-than cumulative table
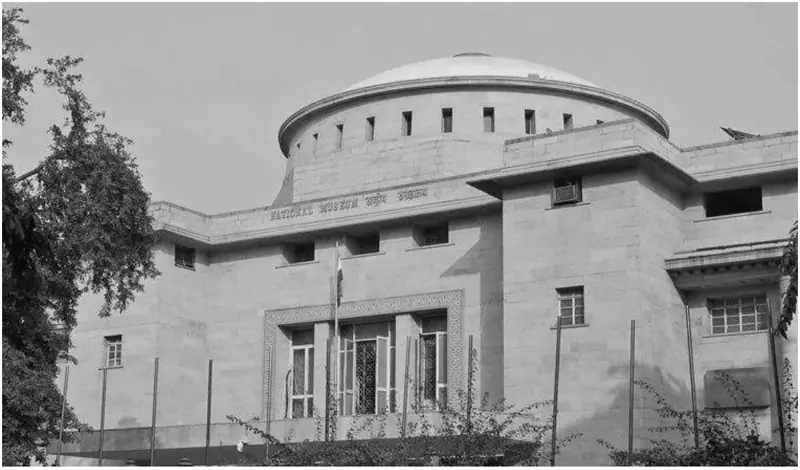
A museum is a place where old relics are kept for public display. A visit to the museum imparts us knowledge about the history, civilization, culture, lifestyle, architecture and art of the country.
A group of 71 people visited the National Museum in Delhi on a certain day. The following table shows their ages:
Photograph retained from the official paper.
Data given in the question
Age (years)
Number of persons
Less than 10
3
Less than 20
10
Less than 30
22
Less than 40
40
Less than 50
54
Less than 60
71
Describe the figure
The original National Museum photograph is retained. The table contains less-than cumulative counts: 3, 10, 22, 40, 54 and 71. These must first be converted into ordinary frequencies.
Appeared in: 2022 · Basic · Supplementary
(a) Find the median age of the persons who visited the museum. [2 marks]
Show answer and solution
Median = 37.5 years.
Ordinary frequencies are successive differences: 3, 10 − 3 = 7, 22 − 10 = 12, 40 − 22 = 18, 54 − 40 = 14 and 71 − 54 = 17. Since these are non-negative ages and the first cumulative group is ‘less than 10’, the first class is taken as 0–10.
Working: cumulative frequencies
Class interval
Frequency fᵢ
Cumulative frequency
0–10
3
3
10–20
7
10
20–30
12
22
30–40
18
40
40–50
14
54
50–60
17
71
n = 71; = 35.5.
The first cumulative frequency greater than 35.5 is 40.
Median class = 30–40.
Here l = 30, cf = 22, f = 18 and h = 10.
Median = l + × h.
Median = 30 + × 10.
Median = 37.5 years.
(b) Find the mean age of the persons who visited the museum. [2 marks]
Show answer and solution
Mean = ≈ 36.83 years.
Ordinary frequencies are successive differences: 3, 10 − 3 = 7, 22 − 10 = 12, 40 − 22 = 18, 54 − 40 = 14 and 71 − 54 = 17. Since these are non-negative ages and the first cumulative group is ‘less than 10’, the first class is taken as 0–10.
Working: direct method
Class interval
fᵢ
xᵢ
fᵢxᵢ
0–10
3
5
15
10–20
7
15
105
20–30
12
25
300
30–40
18
35
630
40–50
14
45
630
50–60
17
55
935
Total
71
—
2615
Class mark xᵢ = .
Total frequency n = Σfᵢ = 71.
Mean x̄ = .
x̄ = = ≈ 36.83 years.
Basic4 marks · 1 + 1 + 2 · Accessible paper
Case 4. Plants contributed for a school clean-up
As part of ‘Swachh Bharat Abhiyan’, some houses of a locality in Delhi decided to clean up and beautify a school of their locality by planting a number of plants. The data indicating the number of plants contributed by different houses is tabulated below:
Data given in the question
Number of plants contributed
Number of houses
1–4
10
4–7
8
7–10
9
10–13
7
13–16
12
16–19
4
The accessible case is text-only. The frequencies count houses, while the class intervals describe the number of plants contributed. Do not interchange these quantities.
Appeared in: 2024 · Basic · Main
Accessible paper: this case is text-only in the source.
(i) Write the median class. [1 mark]
Show answer and solution
Median class = 7–10.
n = 50; = 25.
Working: cumulative frequencies
Class interval
Frequency fᵢ
Cumulative frequency
1–4
10
10
4–7
8
18
7–10
9
27
10–13
7
34
13–16
12
46
16–19
4
50
The first cumulative frequency greater than 25 is 27.
Median class = 7–10.
(ii) Write the modal class. [1 mark]
Show answer and solution
Modal class = 13–16 plants.
The greatest frequency is 12 houses, in the class 13–16 plants.
(iii)(a) Find the median of the given data. [2 marks]
Show answer and solution
Median = ≈ 9.33 plants.
n = 50; = 25.
Working: cumulative frequencies
Class interval
Frequency fᵢ
Cumulative frequency
1–4
10
10
4–7
8
18
7–10
9
27
10–13
7
34
13–16
12
46
16–19
4
50
The first cumulative frequency greater than 25 is 27.
Median class = 7–10.
Here l = 7, cf = 18, f = 9 and h = 3.
Median = l + × h.
Median = 7 + × 3.
Median = ≈ 9.33 plants.
OR
(iii)(b) Find the mode of the given data. [2 marks]
Show answer and solution
Mode = ≈ 14.15 plants.
The greatest frequency is 12, so the modal class is 13–16.
Here l = 13, h = 3, f₁ = 12, f₀ = 7 and f₂ = 4.
Mode = l + × h.
Mode = 13 + × 3.
Mode = ≈ 14.15 plants.
Basic4 marks · 1 + 1 + 2
Case 5. Net Asset Values of mutual funds
Mutual Fund: A mutual fund is a type of investment vehicle that pools money from multiple investors to invest in securities like stocks, bonds or other securities. Mutual funds are operated by professional money managers, who allocate the fund’s assets and attempt to produce capital gains or income for the fund’s investors.
Net Asset Value (NAV) represents a fund’s per share market value. It is the price at which the investors buy fund shares from a fund company and sell them to a fund company.
The following table shows the Net Asset Value (NAV) per unit of mutual fund of ICICI mutual funds:
Illustration retained from the official paper.
Data given in the question
NAV (₹)
Number of mutual funds
0–5
13
5–10
16
10–15
22
15–20
18
20–25
11
Describe the figure
The original mutual-funds illustration is retained. NAV intervals are amounts in rupees; frequencies count mutual funds. There are 80 observations.
Appeared in: 2024 · Basic · Main
(i) What is the upper limit of modal class of the data? [1 mark]
Show answer and solution
Upper limit = ₹15.
The greatest frequency is 22, so the modal class is 10–15.
Its upper limit is 15, not its frequency 22.
(ii) What is the median class of the data? [1 mark]
Show answer and solution
Median class = 10–15.
n = 80; = 40.
Working: cumulative frequencies
Class interval
Frequency fᵢ
Cumulative frequency
0–5
13
13
5–10
16
29
10–15
22
51
15–20
18
69
20–25
11
80
The first cumulative frequency greater than 40 is 51.
Median class = 10–15.
(iii)(a) What is the mode NAV of mutual funds? [2 marks]
Show answer and solution
Mode = 13 rupees.
The greatest frequency is 22, so the modal class is 10–15.
Here l = 10, h = 5, f₁ = 22, f₀ = 16 and f₂ = 18.
Mode = l + × h.
Mode = 10 + × 5.
Mode = 13 rupees.
OR
(iii)(b) What is the median NAV of mutual funds? [2 marks]
Show answer and solution
Median = 12.5 rupees.
n = 80; = 40.
Working: cumulative frequencies
Class interval
Frequency fᵢ
Cumulative frequency
0–5
13
13
5–10
16
29
10–15
22
51
15–20
18
69
20–25
11
80
The first cumulative frequency greater than 40 is 51.
Median class = 10–15.
Here l = 10, cf = 29, f = 22 and h = 5.
Median = l + × h.
Median = 10 + × 5.
Median = 12.5 rupees.
Health, insurance and measurements
Basic4 marks · 2 + 2 · Accessible paper
Case 6. A hospital’s age distribution
COVID-19, also known as Coronavirus, started in India in March, 2020. In spite of complete lockdown in the country, the disease became a pandemic and is still going on.
The following table shows the age distribution of patients admitted on a certain day in a hospital:
Data given in the question
Age (years)
Number of patients
15–25
6
25–35
11
35–45
21
45–55
23
55–65
15
65–75
4
This text-only case is retained from the 2022 accessible paper; its passage describes that paper’s historical context. Ages and frequencies are supplied in the table.
Appeared in: 2022 · Basic · Main
Historical passage retained from the 2022 term-based accessible paper.
(a) In which age group is the number of patients maximum? [2 marks]
Show answer and solution
Age group = 45–55 years.
The greatest frequency is 23.
It belongs to the class 45–55 years.
(b) Find the modal age and the mean age from the given data. [2 marks]
Show answer and solution
Modal age = 47 years; mean age = 45.25 years.
For mode, l = 45, h = 10, f₁ = 23, f₀ = 21 and f₂ = 15.
Health insurance is an agreement whereby the insurance company agrees to undertake a guarantee of compensation for medical expenses in case the insured falls ill or meets with an accident which leads to hospitalisation of the insured. The government also promotes health insurance by providing a deduction from income tax.
An SBI health insurance agent found the following data for distribution of ages of 100 policy holders. The health insurance policies are given to persons having age 15 years and onwards but less than 60 years.
Data given in the question
Age (years)
Number of policy holders
15–20
2
20–25
4
25–30
18
30–35
21
35–40
33
40–45
11
45–50
3
50–55
6
55–60
2
The source case has no illustration. The age intervals are continuous, beginning at 15 years and ending below 60 years. Total frequency is 100.
Appeared in: 2022 · Standard · Supplementary
(a) Find the modal age of the policy holders. [2 marks]
Show answer and solution
Mode = ≈ 36.76 years.
The greatest frequency is 33, so the modal class is 35–40.
Here l = 35, h = 5, f₁ = 33, f₀ = 21 and f₂ = 11.
Mode = l + × h.
Mode = 35 + × 5.
Mode = ≈ 36.76 years.
(b) Find the median age of the policy holders. [2 marks]
Show answer and solution
Median = ≈ 35.76 years.
n = 100; = 50.
Working: cumulative frequencies
Class interval
Frequency fᵢ
Cumulative frequency
15–20
2
2
20–25
4
6
25–30
18
24
30–35
21
45
35–40
33
78
40–45
11
89
45–50
3
92
50–55
6
98
55–60
2
100
The first cumulative frequency greater than 50 is 78.
Median class = 35–40.
Here l = 35, cf = 45, f = 33 and h = 5.
Median = l + × h.
Median = 35 + × 5.
Median = ≈ 35.76 years.
Basic4 marks · 2 + 2 · Accessible paper
Case 8. Weights recorded at a school medical camp
A medical camp was organised in a school to impart health education and to explain the importance of physical exercises to students. During the camp, a medical check up of 35 students was done and their weights were recorded as under:
Data given in the question
Weight (kg)
Number of students
38–40
3
40–42
2
42–44
4
44–46
5
46–48
14
48–50
3
50–52
4
The accessible source is text-only. The weight intervals are in kilograms and their frequencies total 35 students.
Appeared in: 2022 · Basic · Supplementary
(a) Find the median class and hence the median of the data. [2 marks]
Show answer and solution
Median class = 46–48 kg; median = 46.5 kg.
n = 35; = 17.5.
Working: cumulative frequencies
Class interval
Frequency fᵢ
Cumulative frequency
38–40
3
3
40–42
2
5
42–44
4
9
44–46
5
14
46–48
14
28
48–50
3
31
50–52
4
35
The first cumulative frequency greater than 17.5 is 28.
Median class = 46–48.
Here l = 46, cf = 14, f = 14 and h = 2.
Median = l + × h.
Median = 46 + × 2.
Median = 46.5 kg.
(b) Find the modal class and hence the mode of the data. [2 marks]
Show answer and solution
Modal class = 46–48 kg; mode = 46.9 kg.
The greatest frequency is 14, so the modal class is 46–48.
Here l = 46, h = 2, f₁ = 14, f₀ = 5 and f₂ = 3.
Mode = l + × h.
Mode = 46 + × 2.
Mode = 46.9 kg.
Basic4 marks · 1 + 1 + 2
Case 9. Lengths of leaves collected by Gurpreet
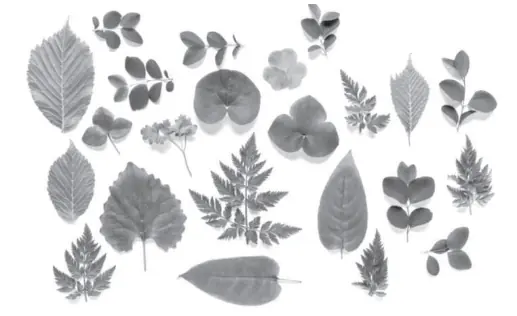
Gurpreet is very fond of doing research on plants. She collected some leaves from different plants and measured their lengths in mm.
The data obtained is represented in the following table:
Photograph retained from the official paper.
Data given in the question
Length (mm)
Number of leaves
70–80
3
80–90
5
90–100
9
100–110
12
110–120
5
120–130
4
130–140
2
Describe the figure
The original leaf photograph is retained. Table lengths are in millimetres; part (ii) gives a threshold in centimetres, so convert 10 cm to 100 mm before counting.
Appeared in: 2024 · Basic · Main
(i) Write the median class of the data. [1 mark]
Show answer and solution
Median class = 100–110.
n = 40; = 20.
Working: cumulative frequencies
Class interval
Frequency fᵢ
Cumulative frequency
70–80
3
3
80–90
5
8
90–100
9
17
100–110
12
29
110–120
5
34
120–130
4
38
130–140
2
40
The first cumulative frequency greater than 20 is 29.
Median class = 100–110.
(ii) How many leaves are of length equal to or more than 10 cm? [1 mark]
Show answer and solution
Number of leaves = 23.
10 cm = 100 mm.
Use the classes 100–110, 110–120, 120–130 and 130–140 mm.
Number = 12 + 5 + 4 + 2 = 23.
(iii)(a) Find median of the data. [2 marks]
Show answer and solution
Median = 102.5 mm.
n = 40; = 20.
Working: cumulative frequencies
Class interval
Frequency fᵢ
Cumulative frequency
70–80
3
3
80–90
5
8
90–100
9
17
100–110
12
29
110–120
5
34
120–130
4
38
130–140
2
40
The first cumulative frequency greater than 20 is 29.
Median class = 100–110.
Here l = 100, cf = 17, f = 12 and h = 10.
Median = l + × h.
Median = 100 + × 10.
Median = 102.5 mm.
OR
(iii)(b) Write the modal class and find the mode of the data. [2 marks]
Show answer and solution
Modal class = 100–110 mm; mode = 103 mm.
The greatest frequency is 12, so the modal class is 100–110.
Here l = 100, h = 10, f₁ = 12, f₀ = 9 and f₂ = 5.
Mode = l + × h.
Mode = 100 + × 10.
Mode = 103 mm.
Basic4 marks · 1 + 1 + 2
Case 10. Heart rates recorded for thirty women
Heart Rate: The heart rate is one of the ‘vital signs’ of health in the human body. It measures the number of times per minute that the heart contracts or beats. While a normal heart rate does not guarantee that a person is free of health problems, it is a useful benchmark for identifying a range of health issues.
Thirty women were examined by doctors of AIIMS and the number of heart beats per minute were recorded and summarized as follows:
Illustration retained from the official paper.
Data given in the question
Heart beats per minute
Number of women
65–68
2
68–71
4
71–74
3
74–77
8
77–80
7
80–83
4
83–86
2
Describe the figure
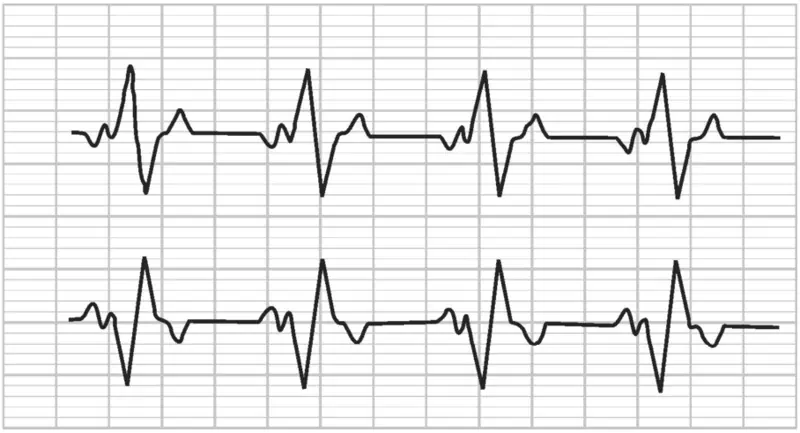
The original heartbeat illustration is retained as context; numerical answers come from the frequency table, not from counting peaks in the illustration. The frequencies total 30 women.
Appeared in: 2024 · Basic · Main
(i) How many women are having heart beat in the range 68–77? [1 mark]
Show answer and solution
Number of women = 15.
Add the frequencies for 68–71, 71–74 and 74–77.
Number = 4 + 3 + 8 = 15.
(ii) What is the median class of heart beats per minute for these women? [1 mark]
Show answer and solution
Median class = 74–77.
n = 30; = 15.
Working: cumulative frequencies
Class interval
Frequency fᵢ
Cumulative frequency
65–68
2
2
68–71
4
6
71–74
3
9
74–77
8
17
77–80
7
24
80–83
4
28
83–86
2
30
The first cumulative frequency greater than 15 is 17.
Median class = 74–77.
(iii)(a) Find the modal value of heart beats per minute for these women. [2 marks]
Show answer and solution
Mode = 76.5 beats per minute.
The greatest frequency is 8, so the modal class is 74–77.
Here l = 74, h = 3, f₁ = 8, f₀ = 3 and f₂ = 7.
Mode = l + × h.
Mode = 74 + × 3.
Mode = 76.5 beats per minute.
OR
(iii)(b) Find the median value of heart beats per minute for these women. [2 marks]
Show answer and solution
Median = 76.25 beats per minute.
n = 30; = 15.
Working: cumulative frequencies
Class interval
Frequency fᵢ
Cumulative frequency
65–68
2
2
68–71
4
6
71–74
3
9
74–77
8
17
77–80
7
24
80–83
4
28
83–86
2
30
The first cumulative frequency greater than 15 is 17.
Median class = 74–77.
Here l = 74, cf = 9, f = 8 and h = 3.
Median = l + × h.
Median = 74 + × 3.
Median = 76.25 beats per minute.
Basic4 marks · 1 + 1 + 2 · Accessible paper
Case 11. Comparing modal ages at two hospitals
The following table shows the age distribution of patients admitted during a day in two different hospitals:
Data given in the question
Age (years)
Hospital I: patients
Hospital II: patients
5–15
6
8
15–25
11
16
25–35
21
32
35–45
23
10
45–55
14
24
55–65
5
12
The accessible source is text-only. Each hospital has its own frequency row. Hospital I has 80 patients and Hospital II has 102; use the correct row for each subpart.
Appeared in: 2024 · Basic · Supplementary
(i) In Hospital I, what is the upper limit of modal class? [1 mark]
Show answer and solution
Upper limit = 45 years.
Hospital I’s greatest frequency is 23, in class 35–45.
The upper class limit is 45 years.
(ii) In Hospital II, what is the lower limit of modal class? [1 mark]
Show answer and solution
Lower limit = 25 years.
Hospital II’s greatest frequency is 32, in class 25–35.
The lower class limit is 25 years.
(iii)(a) Find the mode of the data of Hospital I. [2 marks]
Show answer and solution
Mode = ≈ 36.82 years.
The greatest frequency is 23, so the modal class is 35–45.
Here l = 35, h = 10, f₁ = 23, f₀ = 21 and f₂ = 14.
Mode = l + × h.
Mode = 35 + × 10.
Mode = ≈ 36.82 years.
OR
(iii)(b) Find the mode of the data of Hospital II. [2 marks]
Show answer and solution
Mode = ≈ 29.21 years.
The greatest frequency is 32, so the modal class is 25–35.
Here l = 25, h = 10, f₁ = 32, f₀ = 16 and f₂ = 10.
Mode = l + × h.
Mode = 25 + × 10.
Mode = ≈ 29.21 years.
Schools, training and games
Standard4 marks · 1 + 1 + 2 · Accessible paper
Case 12. A student–teacher survey of 100 schools
Student-teacher ratio expresses the relationship between the number of students enrolled in a school and the number of teachers employed by the school. This ratio is important for a number of reasons. It can be used as a tool to measure teachers’ workload as well as the allocation of resources.
A survey was conducted in 100 secondary schools of a state and the following frequency distribution table was prepared:
Data given in the question
Number of students per teacher
Number of schools
20–25
5
25–30
15
30–35
25
35–40
30
40–45
15
45–50
10
The accessible source is text-only. The observations describe students per teacher and the frequencies describe 100 schools. It uses a different distribution from the higher-secondary-school case.
(i) What is the lower limit of the median class? [1 mark]
Show answer and solution
Lower limit = 35 students per teacher.
Cumulative frequencies are 5, 20, 45, 75, 90 and 100.
n/2 = 50, so the median class is 35–40.
Its lower limit is 35.
(ii) What is the upper limit of the modal class? [1 mark]
Show answer and solution
Upper limit = 40 students per teacher.
The greatest frequency is 30, in class 35–40.
Its upper limit is 40.
(iii)(a) Find the median of the data. [2 marks]
Show answer and solution
Median = ≈ 35.83 students per teacher.
n = 100; = 50.
Working: cumulative frequencies
Class interval
Frequency fᵢ
Cumulative frequency
20–25
5
5
25–30
15
20
30–35
25
45
35–40
30
75
40–45
15
90
45–50
10
100
The first cumulative frequency greater than 50 is 75.
Median class = 35–40.
Here l = 35, cf = 45, f = 30 and h = 5.
Median = l + × h.
Median = 35 + × 5.
Median = ≈ 35.83 students per teacher.
OR
(iii)(b) Find the mode of the data. [2 marks]
Show answer and solution
Mode = 36.25 students per teacher.
The greatest frequency is 30, so the modal class is 35–40.
Here l = 35, h = 5, f₁ = 30, f₀ = 25 and f₂ = 15.
Mode = l + × h.
Mode = 35 + × 5.
Mode = 36.25 students per teacher.
Standard4 marks · 1 + 1 + 2 · Accessible paper
Case 13. Student–teacher ratios in higher secondary schools
A survey was conducted by the Education Ministry of India to record the teacher–student ratio in various higher secondary schools of India. The following distribution was given by the Ministry:
Data given in the question
Number of students/teacher
Number of schools
15–20
3
20–25
8
25–30
9
30–35
10
35–40
3
40–45
2
The accessible source is text-only. The observations are numbers of students per teacher, while frequencies count schools. The total number of schools is 35.
Appeared in: 2024 · Standard · Supplementary
Related setup: the 100-school survey uses different class intervals and frequencies.
(i) Write the modal class. [1 mark]
Show answer and solution
Modal class = 30–35 students per teacher.
The greatest frequency is 10 schools, in the class 30–35.
(ii) Write the median class. [1 mark]
Show answer and solution
Median class = 25–30.
n = 35; = 17.5.
Working: cumulative frequencies
Class interval
Frequency fᵢ
Cumulative frequency
15–20
3
3
20–25
8
11
25–30
9
20
30–35
10
30
35–40
3
33
40–45
2
35
The first cumulative frequency greater than 17.5 is 20.
Median class = 25–30.
(iii)(a) Find the mode of the data. [2 marks]
Show answer and solution
Mode = 30.625 students per teacher.
The greatest frequency is 10, so the modal class is 30–35.
Here l = 30, h = 5, f₁ = 10, f₀ = 9 and f₂ = 3.
Mode = l + × h.
Mode = 30 + × 5.
Mode = 30.625 students per teacher.
OR
(iii)(b) Find the median of the data. [2 marks]
Show answer and solution
Median = ≈ 28.61 students per teacher.
n = 35; = 17.5.
Working: cumulative frequencies
Class interval
Frequency fᵢ
Cumulative frequency
15–20
3
3
20–25
8
11
25–30
9
20
30–35
10
30
35–40
3
33
40–45
2
35
The first cumulative frequency greater than 17.5 is 20.
Median class = 25–30.
Here l = 25, cf = 11, f = 9 and h = 5.
Median = l + × h.
Median = 25 + × 5.
Median = ≈ 28.61 students per teacher.
Standard4 marks · 1 + 2 + 1
Case 14. Ages of vocational-training participants
Vocational training complements traditional education by providing practical skills and hands-on experience. While education equips individuals with a broad knowledge base, vocational training focuses on job-specific skills, enhancing employability thus making the student self-reliant. Keeping this in view, a teacher made the following table giving the frequency distribution of students/adults undergoing vocational training from the training institute.
Illustration retained from the official paper.
Data given in the question
Age (years)
Number of participants
15–19
62
20–24
132
25–29
96
30–34
37
35–39
13
40–44
11
45–49
10
50–54
4
Describe the figure
The original vocational-education word-cloud illustration is retained. The source age classes are inclusive: 15–19, 20–24, and so on. This question asks for class limits and a median class, not a numerical grouped median.
Appeared in: 2024 · Standard · Main
Keep the printed inclusive class limits separate from any continuous boundaries needed for interpolation.
(i) What is the lower limit of the modal class of the above data? [1 mark]
Show answer and solution
Official CBSE answer: 19.5 years, using continuous class boundaries.
The greatest frequency is 132, so the printed modal class is 20–24.
The neighbouring inclusive classes 15–19 and 20–24 have a gap of 1.
Half the gap is 0.5; the continuous modal class is 19.5–24.5.
Its lower boundary is 19.5 years.
Source note: all three 2024 Standard schemes, 30/3/1, 30/3/2 and 30/3/3, give 19.5 on PDF and printed page 19. They interpret the requested lower limit after conversion to continuous classes. The printed class limit remains 20; distinguish it from the continuous boundary.
(ii)(a) Find the median class of the above data. [2 marks]
Show answer and solution
Median class = 19.5–24.5 years in continuous form (printed class: 20–24).
n = 62 + 132 + 96 + 37 + 13 + 11 + 10 + 4 = 365.
= 182.5.
Cumulative frequencies begin 62, 194, 290, … .
The first cumulative frequency greater than 182.5 is 194, in the printed class 20–24.
After conversion, the median class is 19.5–24.5, as shown in the official schemes on PDF and printed page 20.
OR
(ii)(b) Find the number of participants of age less than 50 years who undergo vocational training. [2 marks]
Show answer and solution
Number of participants = 361.
The last class, 50–54, contains 4 participants.
Number younger than 50 = 365 − 4 = 361.
(iii) Give the empirical relationship between mean, median and mode. [1 mark]
Show answer and solution
Mode ≈ 3 × Median − 2 × Mean.
The empirical relationship is commonly written Mode = 3 Median − 2 Mean when used in a question.
It is an approximate relationship, not an exact identity for every distribution.
Standard4 marks · 1 + 1 + 2
Case 15. BINGO: announced numbers and a probability
BINGO is game of chance. The host has 75 balls numbered 1 through 75. Each player has a BINGO card with some numbers written on it. The participant cancels the number on the card when called out a number written on the ball selected at random. Whosoever cancels all the numbers on his/her card, says BINGO and wins the game.
The table given below shows the data of one such game where 48 balls were used before Tara said ‘BINGO’.
Illustration retained from the official paper.
Data given in the question
Numbers announced
Number of times
0–15
8
15–30
9
30–45
10
45–60
12
60–75
9
Describe the figure
The original BINGO illustration is retained. The grouped table describes the 48 announced numbers. The first-draw probability uses all 75 balls numbered 1 through 75, rather than the table’s 48 observations.
Appeared in: 2024 · Standard · Main
Mixed-chapter case: the first-draw probability is solved with the complete passage. Related: Probability.
(i) Write the median class. [1 mark]
Show answer and solution
Median class = 30–45.
n = 48; = 24.
Working: cumulative frequencies
Class interval
Frequency fᵢ
Cumulative frequency
0–15
8
8
15–30
9
17
30–45
10
27
45–60
12
39
60–75
9
48
The first cumulative frequency greater than 24 is 27.
Median class = 30–45.
(ii) When first ball was picked up, what was the probability of calling out an even number? [1 mark]
Show answer and solution
Probability = .
The even numbers are 2, 4, 6, …, 74: there are 37.
There are 75 possible balls on the first draw.
P(even number) = .
(iii)(a) Find median of the given data. [2 marks]
Show answer and solution
Median = 40.5.
n = 48; = 24.
Working: cumulative frequencies
Class interval
Frequency fᵢ
Cumulative frequency
0–15
8
8
15–30
9
17
30–45
10
27
45–60
12
39
60–75
9
48
The first cumulative frequency greater than 24 is 27.
Median class = 30–45.
Here l = 30, cf = 17, f = 10 and h = 15.
Median = l + × h.
Median = 30 + × 15.
Median = 40.5.
OR
(iii)(b) Find mode of the given data. [2 marks]
Show answer and solution
Mode = 51.
The greatest frequency is 12, so the modal class is 45–60.
Here l = 45, h = 15, f₁ = 12, f₀ = 10 and f₂ = 9.
Mode = l + × h.
Mode = 45 + × 15.
Mode = 51.
Standard4 marks · 1 + 2 + 1
Case 16. Times taken to finish a 100 m race
Activities like running or cycling reduce stress and the risk of mental disorders like depression. Running helps build endurance. Children develop stronger bones and muscles and are less prone to gain weight.
The physical education teacher of a school has decided to conduct an inter school running tournament in his school premises. The time taken by a group of students to run 100 m was noted as follows:
Photograph retained from the official paper.
Data given in the question
Time (seconds)
Number of students
0–20
8
20–40
10
40–60
13
60–80
6
80–100
3
Describe the figure
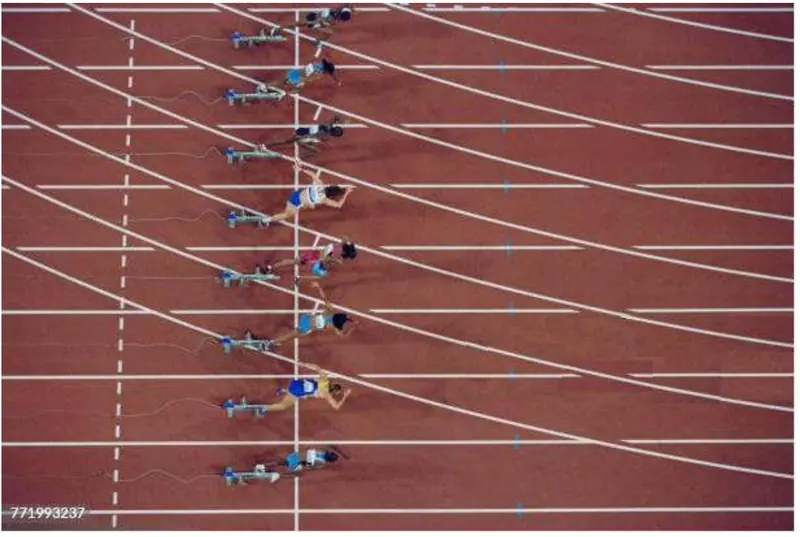
The original running-track photograph is retained. The table records finishing time in seconds for 40 students. Part (iii) asks for a count, not an average time.
Appeared in: 2024 · Standard · Main
(i) What is the median class of the above given data? [1 mark]
Show answer and solution
Median class = 40–60.
n = 40; = 20.
Working: cumulative frequencies
Class interval
Frequency fᵢ
Cumulative frequency
0–20
8
8
20–40
10
18
40–60
13
31
60–80
6
37
80–100
3
40
The first cumulative frequency greater than 20 is 31.
Median class = 40–60.
(ii)(a) Find the mean time taken by the students to finish the race. [2 marks]
Show answer and solution
Mean = 43 seconds.
Class mark xᵢ = .
Working: direct method
Class interval
fᵢ
xᵢ
fᵢxᵢ
0–20
8
10
80
20–40
10
30
300
40–60
13
50
650
60–80
6
70
420
80–100
3
90
270
Total
40
—
1720
Total frequency n = Σfᵢ = 40.
Mean x̄ = .
x̄ = = 43 seconds.
OR
(ii)(b) Find the mode of the above given data. [2 marks]
Show answer and solution
Mode = 46 seconds.
The greatest frequency is 13, so the modal class is 40–60.
Here l = 40, h = 20, f₁ = 13, f₀ = 10 and f₂ = 6.
Mode = l + × h.
Mode = 40 + × 20.
Mode = 46 seconds.
(iii) How many students took time less than 60 seconds? [1 mark]
Show answer and solution
Number of students = 31.
Add the first three class frequencies.
Number = 8 + 10 + 13 = 31.
Standard4 marks · 1 + 1 + 2
Case 17. Class X weekly-test scores
A school conducted a weekly test for Class X students, before the commencement of the pre-board examination and recorded their scores (out of 50). To analyse performance patterns, the academic coordinator grouped the marks into intervals.
The grouped frequency distribution is as below:
Data given in the question
Marks obtained
Number of students
0–10
3
10–20
6
20–30
12
30–40
15
40–50
14
The academic coordinator computed the central tendencies to judge overall learning level, the most common performance range and to understand consistency across the batch for planning the remedial sessions.
The official sample case has no illustration. The grouped marks are out of 50 and the five frequencies total 50 students. The modal class and median class happen to coincide for this table.
Appeared in: 2026–27 · Standard · Official Sample
Official sample: 2026–27 Standard, Q38.
(i) Identify the class with the most common performance range. [1 mark]
Show answer and solution
Most common performance range = 30–40 marks.
The greatest frequency is 15 students in class 30–40.
This is the modal class, not the numerical mode.
(ii) Find the class interval containing the median. [1 mark]
Show answer and solution
Median class = 30–40.
n = 50; = 25.
Working: cumulative frequencies
Class interval
Frequency fᵢ
Cumulative frequency
0–10
3
3
10–20
6
9
20–30
12
21
30–40
15
36
40–50
14
50
The first cumulative frequency greater than 25 is 36.
Median class = 30–40.
(iii)(A) What is the average performance of the students? [2 marks]
Show answer and solution
Mean = 31.2 marks.
Class mark xᵢ = .
Working: direct method
Class interval
fᵢ
xᵢ
fᵢxᵢ
0–10
3
5
15
10–20
6
15
90
20–30
12
25
300
30–40
15
35
525
40–50
14
45
630
Total
50
—
1560
Total frequency n = Σfᵢ = 50.
Mean x̄ = .
x̄ = = 31.2 marks.
OR
(iii)(B) Find the mode of the data. [2 marks]
Show answer and solution
Mode = 37.5 marks.
The greatest frequency is 15, so the modal class is 30–40.
Here l = 30, h = 10, f₁ = 15, f₀ = 12 and f₂ = 14.
Mode = l + × h.
Mode = 30 + × 10.
Mode = 37.5 marks.
Rainfall and air quality
Standard4 marks · 1 + 2 + 1
Case 18. Monsoon rainfall recorded for 2018
India meteorological department observes seasonal and annual rainfall every year in different sub-divisions of our country.
It helps them to compare and analyse the results. The table given below shows sub-division wise seasonal (monsoon) rainfall (mm) in 2018:
Illustration retained from the official paper.
Data given in the question
Rainfall (mm)
Number of sub-divisions
200–400
2
400–600
4
600–800
7
800–1000
4
1000–1200
2
1200–1400
3
1400–1600
1
1600–1800
1
Describe the figure
The original India Meteorological Department emblem is retained. The table concerns 2018 rainfall, although the board question was asked in 2023. It has eight rainfall classes and 24 sub-divisions.
Appeared in: 2023 · Standard · Main
Related setup: the 2023-rainfall case has different frequencies and uses an 800 mm threshold.
(I) Write the modal class. [1 mark]
Show answer and solution
Modal class = 600–800 mm.
The greatest frequency is 7, corresponding to 600–800 mm.
(II) Find the median of the given data. [2 marks]
Show answer and solution
Median = ≈ 771.43 mm.
n = 24; = 12.
Working: cumulative frequencies
Class interval
Frequency fᵢ
Cumulative frequency
200–400
2
2
400–600
4
6
600–800
7
13
800–1000
4
17
1000–1200
2
19
1200–1400
3
22
1400–1600
1
23
1600–1800
1
24
The first cumulative frequency greater than 12 is 13.
Median class = 600–800.
Here l = 600, cf = 6, f = 7 and h = 200.
Median = l + × h.
Median = 600 + × 200.
Median = ≈ 771.43 mm.
OR
(II) Find the mean rainfall in this season. [2 marks]
Show answer and solution
Mean = 850 mm.
Class mark xᵢ = .
Working: direct method
Class interval
fᵢ
xᵢ
fᵢxᵢ
200–400
2
300
600
400–600
4
500
2000
600–800
7
700
4900
800–1000
4
900
3600
1000–1200
2
1100
2200
1200–1400
3
1300
3900
1400–1600
1
1500
1500
1600–1800
1
1700
1700
Total
24
—
20400
Total frequency n = Σfᵢ = 24.
Mean x̄ = .
x̄ = = 850 mm.
(III) If a sub-division having at least 1000 mm rainfall during monsoon season is considered a good rainfall sub-division, how many sub-divisions had good rainfall? [1 mark]
Show answer and solution
Good-rainfall sub-divisions = 7.
At least 1000 mm includes the classes starting at 1000 mm and above.
Number = 2 + 3 + 1 + 1 = 7.
Standard4 marks · 1 + 2 + 1
Case 19. Monsoon rainfall recorded for 2023
The India Meteorological Department observes seasonal and annual rainfall every year in different sub-divisions of our country. It helps them to compare and analyse the results.
The table below shows sub-divisions wise seasonal (monsoon) rainfall (in mm) in 2023.
Illustration retained from the official paper.
Data given in the question
Rainfall (mm)
Number of sub-divisions
200–400
3
400–600
4
600–800
7
800–1000
4
1000–1200
3
1200–1400
3
Describe the figure
The original India Meteorological Department emblem is retained. This case concerns rainfall in 2023 and has a different table and threshold from the earlier 2018-rainfall case. Its frequencies total 24 sub-divisions.
(ii)(a) Find the median of the given data. [2 marks]
Show answer and solution
Median = ≈ 742.86 mm.
n = 24; = 12.
Working: cumulative frequencies
Class interval
Frequency fᵢ
Cumulative frequency
200–400
3
3
400–600
4
7
600–800
7
14
800–1000
4
18
1000–1200
3
21
1200–1400
3
24
The first cumulative frequency greater than 12 is 14.
Median class = 600–800.
Here l = 600, cf = 7, f = 7 and h = 200.
Median = l + × h.
Median = 600 + × 200.
Median = ≈ 742.86 mm.
OR
(ii)(b) Find the mean rainfall in the season. [2 marks]
Show answer and solution
Mean = 775 mm.
Class mark xᵢ = .
Working: direct method
Class interval
fᵢ
xᵢ
fᵢxᵢ
200–400
3
300
900
400–600
4
500
2000
600–800
7
700
4900
800–1000
4
900
3600
1000–1200
3
1100
3300
1200–1400
3
1300
3900
Total
24
—
18600
Total frequency n = Σfᵢ = 24.
Mean x̄ = .
x̄ = = 775 mm.
(iii) If a sub-division having at least 800 mm rainfall during monsoon season is considered a good rainfall sub-division, how many sub-divisions had good rainfall? [1 mark]
Show answer and solution
Good-rainfall sub-divisions = 10.
Use the classes 800–1000, 1000–1200 and 1200–1400 mm.
Number = 4 + 3 + 3 = 10.
Basic4 marks · 1 + 1 + 2
Case 20. A month of Air Quality Index readings
The Air Quality Index (AQI) is a scale from 0 to 500 that indicates air quality, with higher numbers signifying more pollution and greater health concerns.
Mansi collected the daily data of AQI of her city for a month and presented it as given below:
Diagram retained from the official paper.
Data given in the question
AQI range
Number of days
1–100
3
101–200
9
201–300
12
301–400
4
401–500
2
Describe the figure
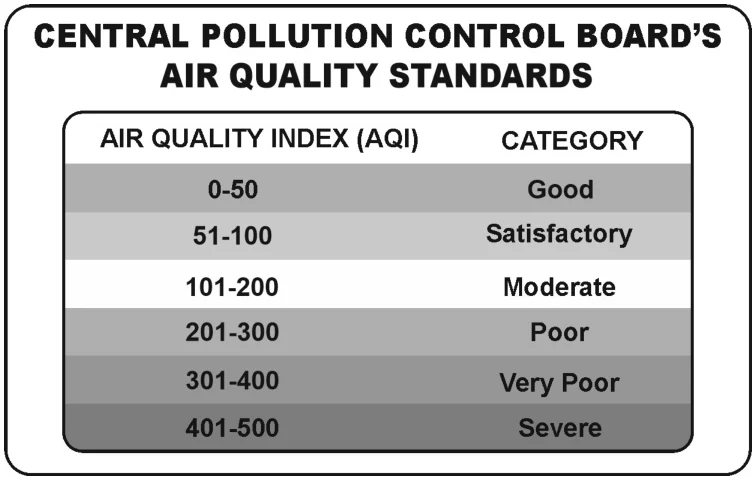
The original AQI reference chart is retained. Its categories are 0–50 Good; 51–100 Satisfactory; 101–200 Moderate; 201–300 Poor; 301–400 Very Poor; 401–500 Severe. The given frequency table uses inclusive intervals 1–100, 101–200, and so on; frequencies are 3, 9, 12, 4 and 2.
Appeared in: 2026 · Basic · Main
(i) Convert the data to continuous frequency distribution. [1 mark]
The gap between successive class limits is 101 − 100 = 1.
Continuous frequency distribution
AQI class
Number of days
0.5–100.5
3
100.5–200.5
9
200.5–300.5
12
300.5–400.5
4
400.5–500.5
2
Half-gap correction = = 0.5.
Subtract 0.5 from each lower limit and add 0.5 to each upper limit.
Frequencies remain unchanged.
(ii) What is the quality of air in most of the days of the month? [1 mark]
Show answer and solution
Air quality: Poor.
The greatest frequency is 12 days in the original interval 201–300.
The printed reference chart labels 201–300 as Poor.
(iii)(a) Using the table formed in part (i), find mode of the data. [2 marks]
Show answer and solution
Mode = ≈ 227.77.
The greatest frequency is 12, so the modal class is 200.5–300.5.
Here l = 200.5, h = 100, f₁ = 12, f₀ = 9 and f₂ = 4.
Mode = l + × h.
Mode = 200.5 + × 100.
Mode = ≈ 227.77.
OR
(iii)(b) Using the table formed in part (i), find median of the data. [2 marks]
Show answer and solution
Median = 225.5.
n = 30; = 15.
Working: cumulative frequencies
Class interval
Frequency fᵢ
Cumulative frequency
0.5–100.5
3
3
100.5–200.5
9
12
200.5–300.5
12
24
300.5–400.5
4
28
400.5–500.5
2
30
The first cumulative frequency greater than 15 is 24.
Median class = 200.5–300.5.
Here l = 200.5, cf = 12, f = 12 and h = 100.
Median = l + × h.
Median = 200.5 + × 100.
Median = 225.5.
Standard4 marks · 1 + 1 + 2
Case 21. Sulphur dioxide concentrations in Delhi
Sulphur dioxide (SO₂) is a major air pollutant, and has significant impact upon human health. It influences the plants communities as well as animal life.
To find out concentration of SO₂ in the air (in parts per million i.e., ppm), the data was collected from 30 localities in Delhi and is presented below:
Data given in the question
Concentration of SO₂ (ppm)
Frequency
0.00–0.04
4
0.04–0.08
8
0.08–0.12
10
0.12–0.16
2
0.16–0.20
4
0.20–0.24
2
The source contains no illustration. Concentrations are in parts per million, with class width 0.04 ppm. Preserve the leading zeros and decimal positions in the given table.
Appeared in: 2026 · Standard · Second Board Examination
(i) What is the lower limit of median class? [1 mark]
Show answer and solution
Lower limit = 0.08 ppm.
Cumulative frequencies are 4, 12, 22, 24, 28 and 30.
n/2 = 15. The first cumulative frequency greater than 15 is 22.
The median class is 0.08–0.12, whose lower limit is 0.08.
(ii) What is the modal class of the above data? [1 mark]
Show answer and solution
Modal class = 0.08–0.12 ppm.
The greatest frequency is 10, in class 0.08–0.12 ppm.
(iii)(a) What is the mean concentration of SO₂ in air? [2 marks]
Show answer and solution
Mean = 0.1 ppm.
Class mark xᵢ = .
Working: direct method
Class interval
fᵢ
xᵢ
fᵢxᵢ
0.00–0.04
4
0.02
0.08
0.04–0.08
8
0.06
0.48
0.08–0.12
10
0.1
1
0.12–0.16
2
0.14
0.28
0.16–0.20
4
0.18
0.72
0.20–0.24
2
0.22
0.44
Total
30
—
3
Total frequency n = Σfᵢ = 30.
Mean x̄ = .
x̄ = = 0.1 ppm.
OR
(iii)(b) Find the median of the above data. [2 marks]
Show answer and solution
Median = 0.092 ppm.
n = 30; = 15.
Working: cumulative frequencies
Class interval
Frequency fᵢ
Cumulative frequency
0.00–0.04
4
4
0.04–0.08
8
12
0.08–0.12
10
22
0.12–0.16
2
24
0.16–0.20
4
28
0.20–0.24
2
30
The first cumulative frequency greater than 15 is 22.
Median class = 0.08–0.12.
Here l = 0.08, cf = 12, f = 10 and h = 0.04.
Median = l + × h.
Median = 0.08 + × 0.04.
Median = 0.092 ppm.
Questions students ask
How do I know whether a table is cumulative?
Labels such as “less than” or “more than” indicate cumulative counts. Recover ordinary frequencies before calculating a mean or mode. The museum case shows the successive subtraction.
How do I identify the median class?
Find n/2 and the cumulative frequencies. NCERT selects the class whose cumulative frequency is greater than and nearest to n/2. If n/2 equals the cumulative frequency at a class junction, this rule selects the next class.
Are modal class and mode the same answer?
No. A modal class is an interval, such as 30–40 marks. The numerical mode is an estimated value obtained from the grouped-mode formula. The weekly-test case asks for both in different parts.
When should I subtract and add 0.5?
Use half the gap when integer-inclusive classes must be made continuous. In the AQI case, 1–100 and 101–200 become 0.5–100.5 and 100.5–200.5. Do not automatically adjust already continuous classes.
What is the difference between a class limit and a class boundary?
For the printed class 20–24, the lower class limit is 20. If the adjacent inclusive classes are converted to continuous form, the lower boundary is 19.5. In the vocational case, CBSE first converts the classes and gives 19.5 in its marking schemes. This page shows that official answer while distinguishing it from the printed limit of 20.
Why is the BINGO probability 37/75 rather than a fraction with denominator 48?
The first draw uses all 75 balls numbered 1 to 75, including 37 even numbers. The frequency table describes the 48 numbers announced later in one game. It is a different total.
Why does the yoga-camp added-person part have no whole-number answer?
The printed data give (7830 + 70x)/(140 + x) = 58, so x = 145/6. This is not a valid number of people. The 2022 Standard 30/4/1 marking scheme, PDF and printed page 11, says an attempted answer “will be awarded full credit of 2 marks”.
Can a mean or a grouped mode be a decimal?
Yes. These measures need not be whole observed values. A mean age, mean time or estimated modal value can be decimal even when the frequencies are whole-number counts.
Do I need to use step deviation for every mean?
Use the method requested. Otherwise choose a convenient NCERT method. These worked tables use the direct method; assumed mean and step deviation give the same mean when applied correctly.
Should I round intermediate totals?
No. Keep exact totals and fractions, then round the final result. These solutions usually show two decimal places for non-terminating values; terminating values retain their exact decimals.
Do I answer both OR alternatives?
Answer one where OR is printed. Both alternatives are solved here for practice. Follow each case’s printed marks: the older 2022 cases use 2 + 2; later cases here use 1 + 1 + 2 or 1 + 2 + 1.
All answers are present before filters run. Both OR alternatives are listed for practice.
How to approach a case study
Read the passage, table headings and units; identify what the frequencies count.
Check the intervals and convert cumulative frequencies or inclusive classes only when required.
Write the required formula, substitute the given values and simplify one step per line.
Keep each subpart’s conditions separate, check the total frequency and round only at the end.
About these questions and solutions
Selected official CBSE cases, with exact repeats merged and original passages, table values, illustrations, marks and OR choices retained.
Solutions prepared by Team TutorVertex in NCERT style; source-specific interpretations and the yoga-camp full-credit note are explained beside the affected answers.
Official sources — View papers and marking schemesCase 1 sources
2022 · Standard · main · 30/4/1 · Q13 — Official question-paper archive · Official marking schemeQuestion file: Math_S/30-4-1 Maths Standard.pdf Marking-scheme file: Mathematic_Standard/041_30_4_1_Mathematics (Standard).pdf Question PDF page 9; marking-scheme PDF pages 10, 11.
2022 · Standard · main · 30/4/2 · Q14 — Official question-paper archive · Official marking schemeQuestion file: Math_S/30-4-2 Maths Standard.pdf Marking-scheme file: Mathematic_Standard/041_30_4_2_Mathematics (Standard).pdf Question PDF page 11; marking-scheme PDF pages 11, 12.
2022 · Standard · main · 30/4/3 · Q13 — Official question-paper archive · Official marking schemeQuestion file: Math_S/30-4-3 Maths Standard.pdf Marking-scheme file: Mathematic_Standard/041_30_4_3_Mathematics (Standard).pdf Question PDF page 9; marking-scheme PDF pages 10, 11.
Case 2 sources
2022 · Basic · main · 430/4/1 · Q13 — Official question-paper archive · Official marking schemeQuestion file: Math_B/430-4-1 Maths Basic.pdf Marking-scheme file: Mathematics basic/Maths Basic Paper code 430.4.1.pdf Question PDF page 9; marking-scheme PDF pages 6, 7.
2022 · Basic · main · 430/4/2 · Q13 — Official question-paper archive · Official marking schemeQuestion file: Math_B/430-4-2 Maths Basic.pdf Marking-scheme file: Mathematics basic/241_430_4_2_Mathematics (Basic).pdf Question PDF page 9; marking-scheme PDF pages 6, 7.
2022 · Basic · main · 430/4/3 · Q13 — Official question-paper archive · Official marking schemeQuestion file: Math_B/430-4-3 Maths Basic.pdf Marking-scheme file: Mathematics basic/241_430_4_3_Mathematics (Basic).pdf Question PDF page 9; marking-scheme PDF page 7.
Case 3 sources
2022 · Basic · supplementary · 430/6/1 · Q13 — Official question-paper archive · Official marking schemeQuestion file: Maths_Basic/430-6-1 maths basic.pdf Marking-scheme file: Math basic/430.6.1.pdf Question PDF page 9; marking-scheme PDF page 6.
2022 · Basic · supplementary · 430/6/2 · Q13 — Official question-paper archive · Official marking schemeQuestion file: Maths_Basic/430-6-2 maths basic.pdf Marking-scheme file: Math basic/430.6.2.pdf Question PDF page 9; marking-scheme PDF page 6.
2022 · Basic · supplementary · 430/6/3 · Q14 — Official question-paper archive · Official marking schemeQuestion file: Maths_Basic/430-6-3 maths basic.pdf Marking-scheme file: Math basic/430.6.3.pdf Question PDF page 11; marking-scheme PDF page 6.
Case 4 sources
2024 · Basic · main · 430(B) · Q37 — Official question-paper archive · Official marking schemeQuestion file: MATHEMATICS_BASIC/430(B) Maths Basic for VI.pdf Marking-scheme file: Mathematics/X_241_MS_430(B)_Unsigned.pdf Question PDF pages 21, 23; marking-scheme PDF page 15.
Case 5 sources
2024 · Basic · main · 430/4/1 · Q36 — Official question-paper archive · Official marking schemeQuestion file: MATHEMATICS_BASIC/430-4-1MATHEMATICS (BASIC).pdf Marking-scheme file: Mathematics/X_241_MS_430_4_1_Unsigned.pdf Question PDF pages 19, 21; marking-scheme PDF pages 16, 17.
2024 · Basic · main · 430/4/2 · Q38 — Official question-paper archive · Official marking schemeQuestion file: MATHEMATICS_BASIC/430-4-2MATHEMATICS (BASIC).pdf Marking-scheme file: Mathematics/X_241_MS_430_4_2_Unsigned.pdf Question PDF page 23; marking-scheme PDF page 18.
2024 · Basic · main · 430/4/3 · Q37 — Official question-paper archive · Official marking schemeQuestion file: MATHEMATICS_BASIC/430-4-3MATHEMATICS (BASIC).pdf Marking-scheme file: Mathematics/X_241_MS_430_4_3_Unsigned.pdf Question PDF page 21; marking-scheme PDF page 17.
Case 6 sources
2022 · Basic · main · 430/B/5 · Q13 — Official question-paper archive · Official marking schemeQuestion file: Math_B/430-B-5 Maths Basic for VI candidates.pdf Marking-scheme file: Mathematics basic/Maths Basic Paper code 430.B.5.pdf Question PDF page 9; marking-scheme PDF page 5.
Case 7 sources
2022 · Standard · supplementary · 30/6/1 · Q14 — Official question-paper archive · Official marking schemeQuestion file: Maths_Std/30-6-1 Maths Std..pdf Marking-scheme file: Math standered/30-6-1.pdf Question PDF page 11; marking-scheme PDF pages 11, 12, 13.
2022 · Standard · supplementary · 30/6/2 · Q14 — Official question-paper archive · Official marking schemeQuestion file: Maths_Std/30-6-2 Maths Std..pdf Marking-scheme file: Math standered/30-6-2.pdf Question PDF page 11; marking-scheme PDF pages 12, 13, 14.
2022 · Standard · supplementary · 30/6/3 · Q13 — Official question-paper archive · Official marking schemeQuestion file: Maths_Std/30-6-3 Maths Std..pdf Marking-scheme file: Math standered/30-6-3.pdf Question PDF page 9; marking-scheme PDF pages 10, 11, 12.
Case 8 sources
2022 · Basic · supplementary · 430/B/6 · Q14 — Official question-paper archive · Official marking schemeQuestion file: Maths_Basic/430-B-6 Maths Basic Blind.pdf Marking-scheme file: Math basic/430.B.6.pdf Question PDF page 11; marking-scheme PDF page 6.
Case 9 sources
2024 · Basic · main · 430/1/3 · Q37 — Official question-paper archive · Official marking schemeQuestion file: MATHEMATICS_BASIC/430-1-3MATHEMATICS (BASIC).pdf Marking-scheme file: Mathematics/X_241_MS_430_1_3_Unsigned.pdf Question PDF pages 13, 15; marking-scheme PDF pages 17, 18.
2024 · Basic · main · 430/1/2 · Q36 — Official question-paper archive · Official marking schemeQuestion file: MATHEMATICS_BASIC/430-1-2MATHEMATICS (BASIC).pdf Marking-scheme file: Mathematics/X_241_MS_430_1_2_Unsigned.pdf Question PDF page 13; marking-scheme PDF pages 15, 16.
Case 10 sources
2024 · Basic · main · 430/2/1 · Q37 — Official question-paper archive · Official marking schemeQuestion file: MATHEMATICS_BASIC/430-2-1MATHEMATICS (BASIC).pdf Marking-scheme file: Mathematics/X_241_MS_430_2_1_Unsigned.pdf Question PDF page 21; marking-scheme PDF pages 19, 20.
2024 · Basic · main · 430/2/2 · Q36 — Official question-paper archive · Official marking schemeQuestion file: MATHEMATICS_BASIC/430-2-2MATHEMATICS (BASIC).pdf Marking-scheme file: Mathematics/X_241_MS_430_2_2_Unsigned.pdf Question PDF page 19; marking-scheme PDF page 18.
2024 · Basic · main · 430/2/3 · Q38 — Official question-paper archive · Official marking schemeQuestion file: MATHEMATICS_BASIC/430-2-3MATHEMATICS (BASIC).pdf Marking-scheme file: Mathematics/X_241_MS_430_2_3_Unsigned.pdf Question PDF page 23; marking-scheme PDF pages 20, 21.
Case 11 sources
2024 · Basic · supplementary · 430(B)/S · Q37 — Official question-paper archive · Official marking schemeQuestion file: 430(B)-S Mathematics Basic.pdf Marking-scheme file: Maths Basic/X_241_MS_ 430_B_S.pdf Question PDF page 21; marking-scheme PDF page 17.
Case 12 sources
2024 · Standard · main · 30(B) · Q36 — Official question-paper archive · Official marking schemeQuestion file: MATHEMATICS_STANDARD/30(B) Mathematics.pdf Marking-scheme file: Mathematics_Standard/MS 041_30(B) Mathematics 2023-24.pdf Question PDF pages 19, 21; marking-scheme PDF pages 16, 17.
Case 13 sources
2024 · Standard · supplementary · 30(B)/S · Q38 — Official question-paper archive · Official marking schemeQuestion file: 30(B) Mathematics Standard.pdf Marking-scheme file: MATHS STANDARD/MS_041_30(B)-S Mathematics 2023-24.pdf Question PDF page 23; marking-scheme PDF page 16.
Case 14 sources
2024 · Standard · main · 30/3/1 · Q37 — Official question-paper archive · Official marking schemeQuestion file: MATHEMATICS_STANDARD/30-3-1(Mathematics Standard).pdf Marking-scheme file: Mathematics_Standard/MS 041_30-3-1 Mathematics 2023-24.pdf Question PDF pages 21, 23; marking-scheme PDF pages 19, 20.
2024 · Standard · main · 30/3/2 · Q38 — Official question-paper archive · Official marking schemeQuestion file: MATHEMATICS_STANDARD/30-3-2(Mathematics Standard).pdf Marking-scheme file: Mathematics_Standard/MS 041_30-3-2 Mathematics 2023-24.pdf Question PDF page 23; marking-scheme PDF pages 19, 20.
2024 · Standard · main · 30/3/3 · Q36 — Official question-paper archive · Official marking schemeQuestion file: MATHEMATICS_STANDARD/30-3-3(Mathematics Standard).pdf Marking-scheme file: Mathematics_Standard/MS 041_30-3-3 Mathematics 2023-24.pdf Question PDF page 21; marking-scheme PDF pages 19, 20.
Case 15 sources
2024 · Standard · main · 30/1/1 · Q37 — Official question-paper archive · Official marking schemeQuestion file: MATHEMATICS_STANDARD/30-1-1(Mathematics Standard).pdf Marking-scheme file: Mathematics_Standard/MS 041_30-1-1 Mathematics 2023-24.pdf Question PDF pages 13, 15; marking-scheme PDF page 17.
2024 · Standard · main · 30/1/2 · Q36 — Official question-paper archive · Official marking schemeQuestion file: MATHEMATICS_STANDARD/30-1-2(Mathematics Standard).pdf Marking-scheme file: Mathematics_Standard/MS 041_30-1-2 Mathematics 2023-24.pdf Question PDF pages 11, 13; marking-scheme PDF page 16.
2024 · Standard · main · 30/1/3 · Q37 — Official question-paper archive · Official marking schemeQuestion file: MATHEMATICS_STANDARD/30-1-3(Mathematics Standard).pdf Marking-scheme file: Mathematics_Standard/MS 041_30-1-3 Mathematics 2023-24.pdf Question PDF pages 13, 15; marking-scheme PDF pages 16, 17.
Case 16 sources
2024 · Standard · main · 30/5/1 · Q38 — Official question-paper archive · Official marking schemeQuestion file: MATHEMATICS_STANDARD/30-5-1(Mathematics Standard).pdf Marking-scheme file: Mathematics_Standard/MS 041_30-5-1 Mathematics 2023-24.pdf Question PDF page 23; marking-scheme PDF pages 17, 18.
2024 · Standard · main · 30/5/2 · Q36 — Official question-paper archive · Official marking schemeQuestion file: MATHEMATICS_STANDARD/30-5-2(Mathematics Standard).pdf Marking-scheme file: Mathematics_Standard/MS 041_30-5-2 Mathematics 2023-24.pdf Question PDF pages 19, 21; marking-scheme PDF pages 15, 16.
2024 · Standard · main · 30/5/3 · Q37 — Official question-paper archive · Official marking schemeQuestion file: MATHEMATICS_STANDARD/30-5-3(Mathematics Standard).pdf Marking-scheme file: Mathematics_Standard/MS 041_30-5-3 Mathematics 2023-24.pdf Question PDF pages 21, 23; marking-scheme PDF pages 16, 17.
Case 17 sources
2026–27 · Standard · Official sample · Q38 — Official sample question paper · Official marking schemeQuestion file: MathsStandard-SQP.pdf Marking-scheme file: MathsStandard-MS.pdf Question PDF page 6; marking-scheme PDF pages 11, 12.
Case 18 sources
2023 · Standard · main · 30/1/1 · Q37 — Official question-paper archive · Official marking schemeQuestion file: MATHEMATICS_STANDARD/30_1_1_Maths Standard.pdf Marking-scheme file: Maths_Standard/MS 041_30-1-1 Mathematics 2022-23.pdf Question PDF page 21; marking-scheme PDF pages 18, 19, 20.
2023 · Standard · main · 30/1/2 · Q38 — Official question-paper archive · Official marking schemeQuestion file: MATHEMATICS_STANDARD/30_1_2_Maths Standard.pdf Marking-scheme file: Maths_Standard/MS 041_30-1-2 Mathematics 2022-23.pdf Question PDF pages 21, 23; marking-scheme PDF pages 20, 21, 22, 23.
2023 · Standard · main · 30/1/3 · Q36 — Official question-paper archive · Official marking schemeQuestion file: MATHEMATICS_STANDARD/30_1_3_Maths Standard.pdf Marking-scheme file: Maths_Standard/MS 041_30-1-3 Mathematics 2022-23.pdf Question PDF pages 19, 21; marking-scheme PDF pages 19, 20, 21.
Case 19 sources
2025 · Standard · main · 30/3/1 · Q38 — Official question-paper archive · Official marking schemeQuestion file: 041_Mathematics_Standard/30-3-1_Mathematics Standard.pdf Marking-scheme file: Math/041 Mathematics Standard/X_MS_041_Mathematics Standard_30-3-1_2024-25.pdf Question PDF page 23; marking-scheme PDF pages 20, 21, 22.
2025 · Standard · main · 30/3/2 · Q36 — Official question-paper archive · Official marking schemeQuestion file: 041_Mathematics_Standard/30-3-2_Mathematics Standard.pdf Marking-scheme file: Math/041 Mathematics Standard/X_MS_041_Mathematics Standard_30-3-2_2024-25.pdf Question PDF page 19; marking-scheme PDF pages 17, 18.
2025 · Standard · main · 30/3/3 · Q37 — Official question-paper archive · Official marking schemeQuestion file: 041_Mathematics_Standard/30-3-3_Mathematics Standard.pdf Marking-scheme file: Math/041 Mathematics Standard/X_MS_041_Mathematics Standard_30-3-3_2024-25.pdf Question PDF page 21; marking-scheme PDF pages 19, 20, 21.